
US100 is in the midst of a downward correction. Taking a look at the D1 interval, we can see that the index has reached the first major support today, marked with the lower limit of 1:1 market geometry and 100-period EMA. In case bulls manage to defend this level, a bounce towards high levels may follow. On the other hand, should US100 deepen declined, the next major support to watch can be found at 12,100 pts and is marked with the lower limit of a large Overbalance structure. According to Overbalance methodology, breaking below this level would signal a mid-term trend shift to bearish.
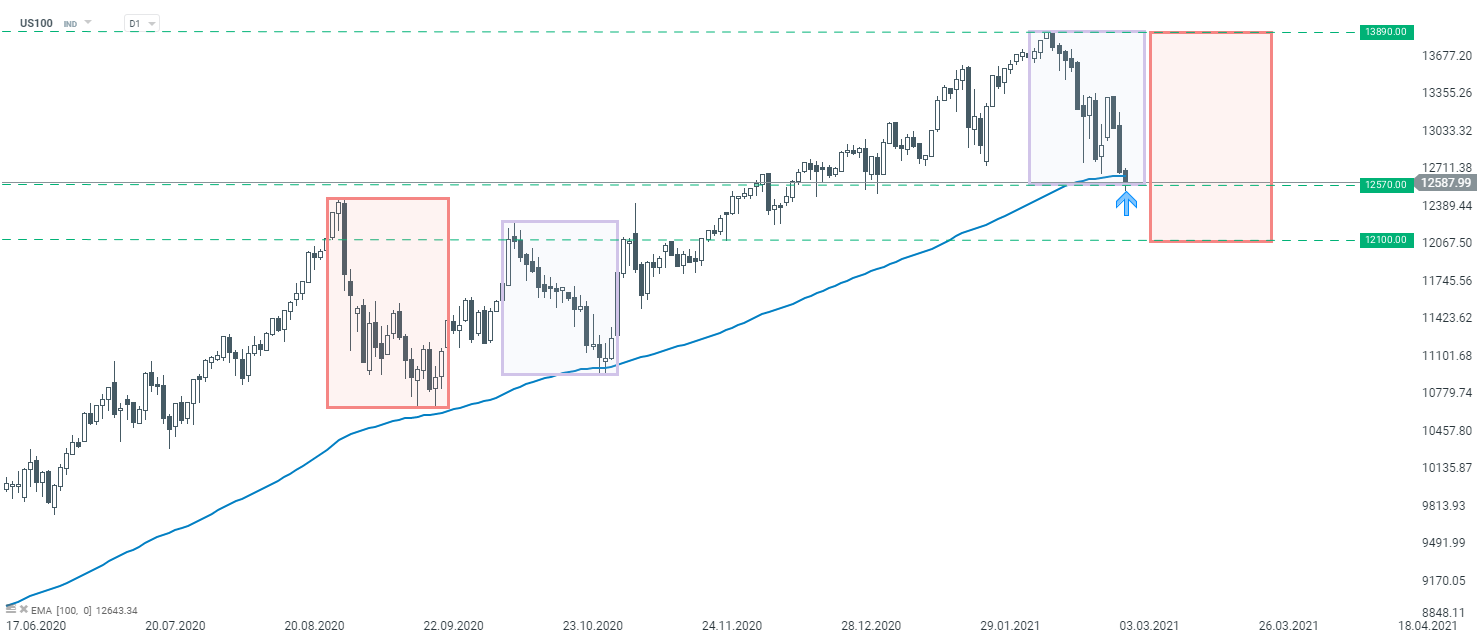 Source: xStation5

Daily Summary: Wall Street Regains Ground; Another Intervention in the Yen Market❓

Three Markets to Watch Next Week (July 31, 2026)

Market Wrap: European equities at 3-week highs! Apple dips in US premarket!

Economic Calendar: Key European CPI Readings and Oil Giants’ Earnings