
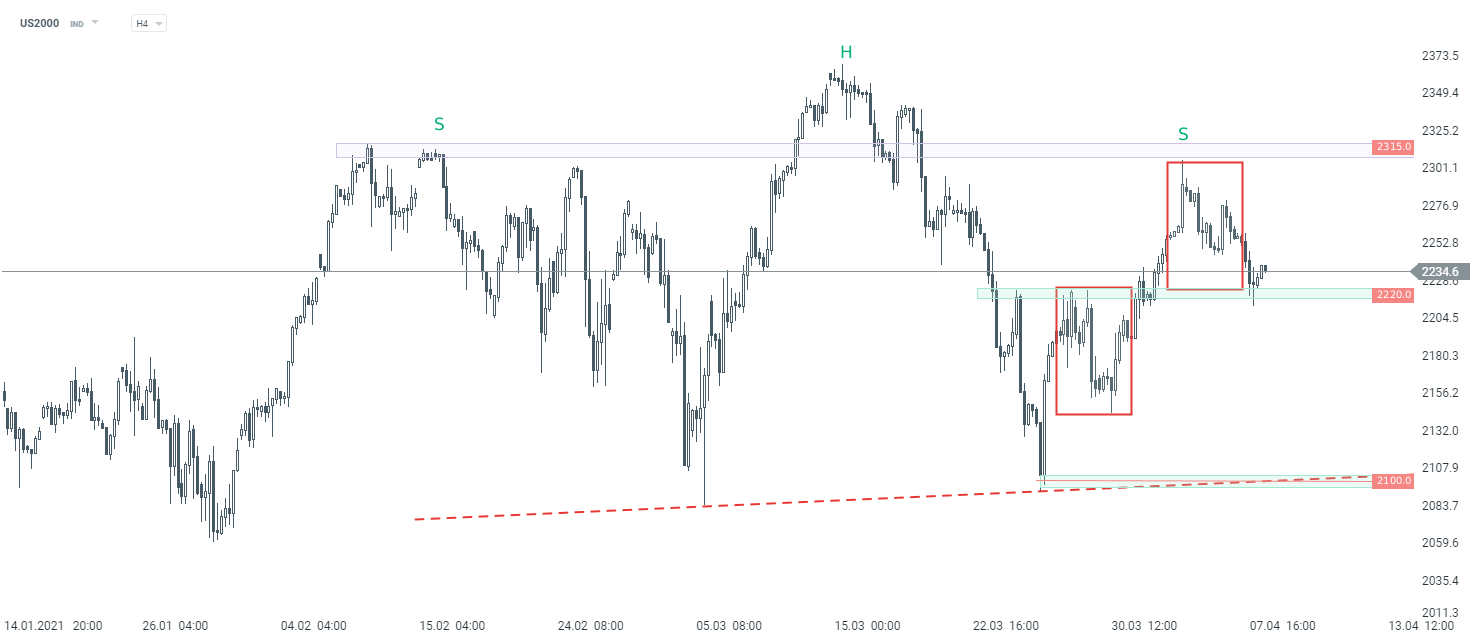
Russell 2000 (US2000) was a top laggard among major US indices yesterday. Small-cap index dropped 1.60% while other Wall Street benchmarks finished little changed. US2000 found itself in an interesting technical spot. The index looks to be trading within a large head and shoulders pattern with 2,315 pts area marking shoulderline and 2,100 pts area marking the neckline. US2000 pulled back after painting a right shoulder but the downward move has been halted at the 2,220 pts price zone. This zone is marked with the lower limit of a local market geometry. If bulls manage to launch an upward move and break back above the 2,315 pts area, head and shoulders setup would be invalidated. On the other hand, breaking below 2,220 pts zone could hint at an acceleration of the downward move and would support a bearish scenario.
 Source: xStation5

Eurozone PMIs: German Factory Revival Masks Underlying Stagnation 🇪🇺

Wall Street rebounds as Q2 earnings season significantly exceeds investors expectations

Morning Wrap: USA Halts Strikes – Oil Down, Stocks Up (03.08.2026)

Daily Summary: Wall Street Regains Ground; Another Intervention in the Yen Market❓