
We are just beginning the last holiday week in the markets. During this period, we can expect reduced market liquidity and lower volatility. Nevertheless, on the main US500 stock index, we observe an interesting technical structure that may signal a short-term correction. This scenario also seems to be supported by seasonality associated with the end of the calendar year.
An analysis of the index's behavior over the past 10 years indicates that the last days of the year, along with the first days of the following year, have often seen a noticeable profit-taking trend. This refers to the final few days of the year and the first three days of the new year.
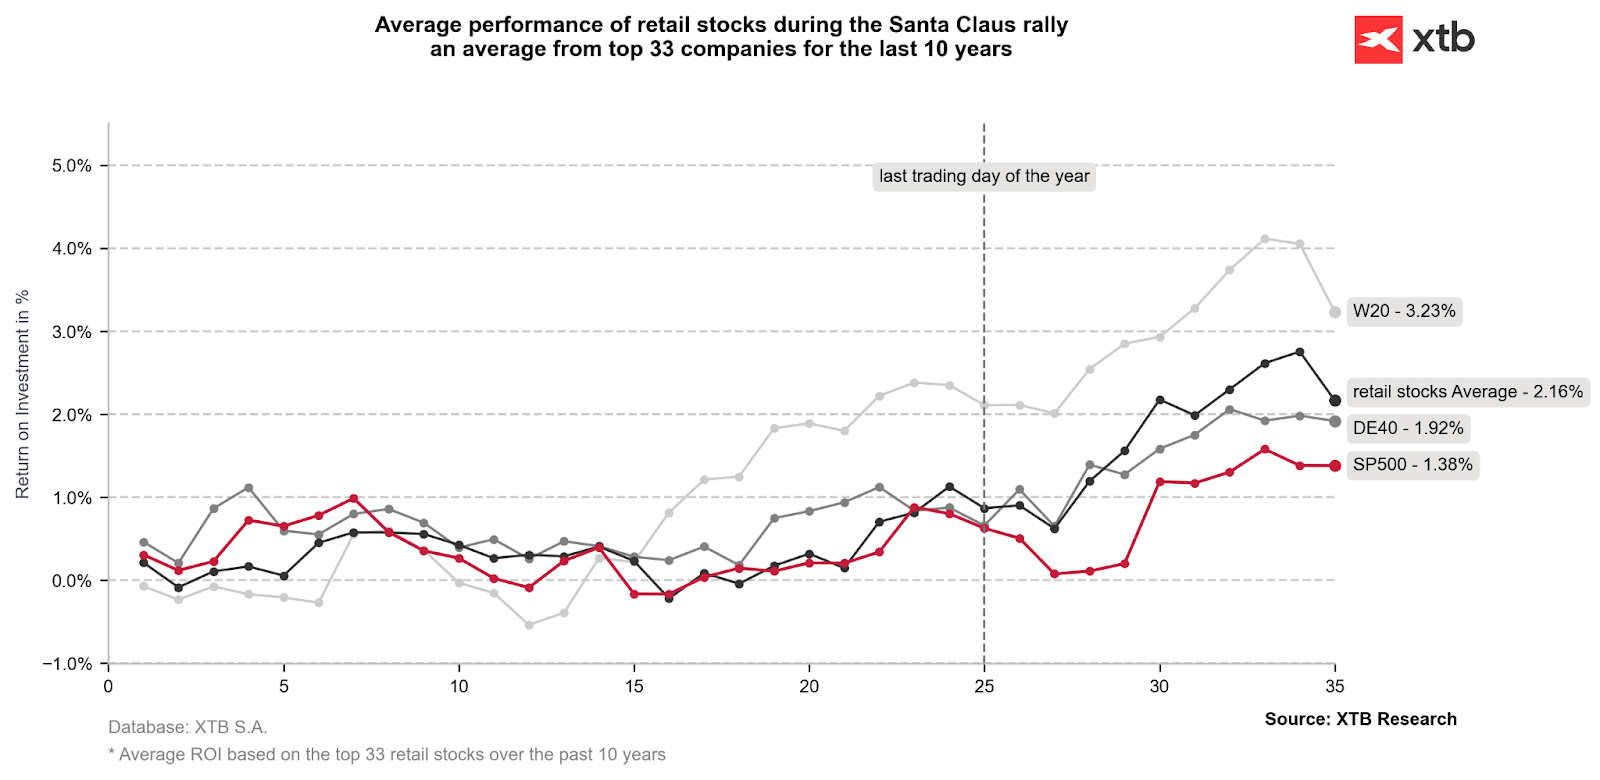
On the chart above, a vertical line marks the last trading day on the U.S. stock exchange. Around this date, we clearly observe a weakening in the SP500 index.
The weakness in stocks may be attributed to several factors:
- Tax-loss optimization – the realization of capital losses before the end of the calendar year to offset gains and reduce taxable income.
- Portfolio rebalancing and “window dressing” – investment funds and institutional investors often adjust their portfolios before finalizing year-end reports.
- Lower liquidity and holiday season – trading volumes typically decline during the holiday season as many market participants take time off.


Daily Summary: Semiconductors Rise in the Shadow of Geopolitical Turmoil

Did SaaS lost too much? Morgan Stanley says yes.

Tech sector catches its breath 🚀

US OPEN: Semiconductors drive a rebound