
Yesterday, the US dollar index (USDIDX) fell to its lowest level in five months, with similar declines noted against the euro. The dollar's weakness stems from rising investor expectations of potential interest rate cuts in the US in the upcoming year 2024. However, market movements may be exaggerated due to low liquidity during the holiday season. The recent downward trend in the dollar was further compounded by a drop in Treasury yields, particularly the 2-year yields, which reached their lowest level since the end of May.
From a technical perspective, looking at the chart, we can see that the current declines have halted around the 100,000 point mark. This area has twice served as a turning point on the chart this year, marking local troughs in January and April. Only in July of this year did the USDIDX manage to break below this barrier. However, the movement was quickly reversed, and the rates fell only to 99,400 points before returning above the 100,000 level. Therefore, the current level will be crucial in determining whether the current downward trend will continue or if we will see a correction at the beginning of the new year. In the case of a correction, the levels to watch are 101,936 and 102,884, which represent the 23.6% and 38.2% Fibonacci retracement levels, respectively. In the case of a continuation of the downward movement, the first level worth observing is this year's local trough, around 99,400 points.
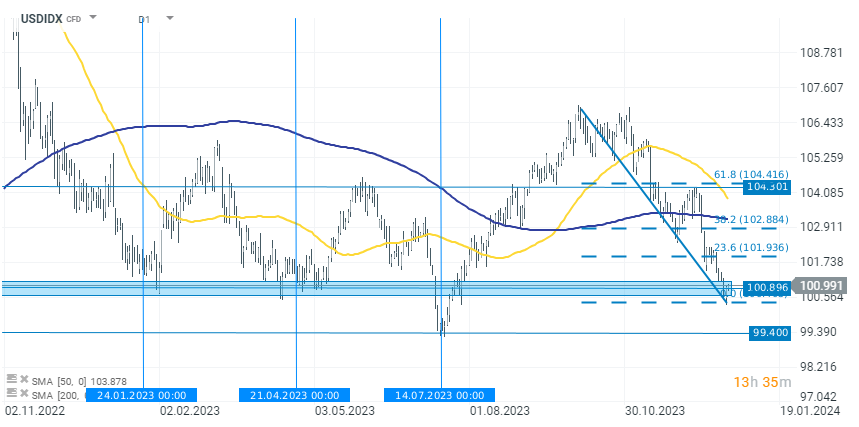
Source: xStation 5

Daily Summary: Wall Street Regains Ground; Another Intervention in the Yen Market❓

Three Markets to Watch Next Week (July 31, 2026)

Market Wrap: European equities at 3-week highs! Apple dips in US premarket!

Chart of the Day: EURUSD after the Fed meeting. The market scales back rate hike expectations