
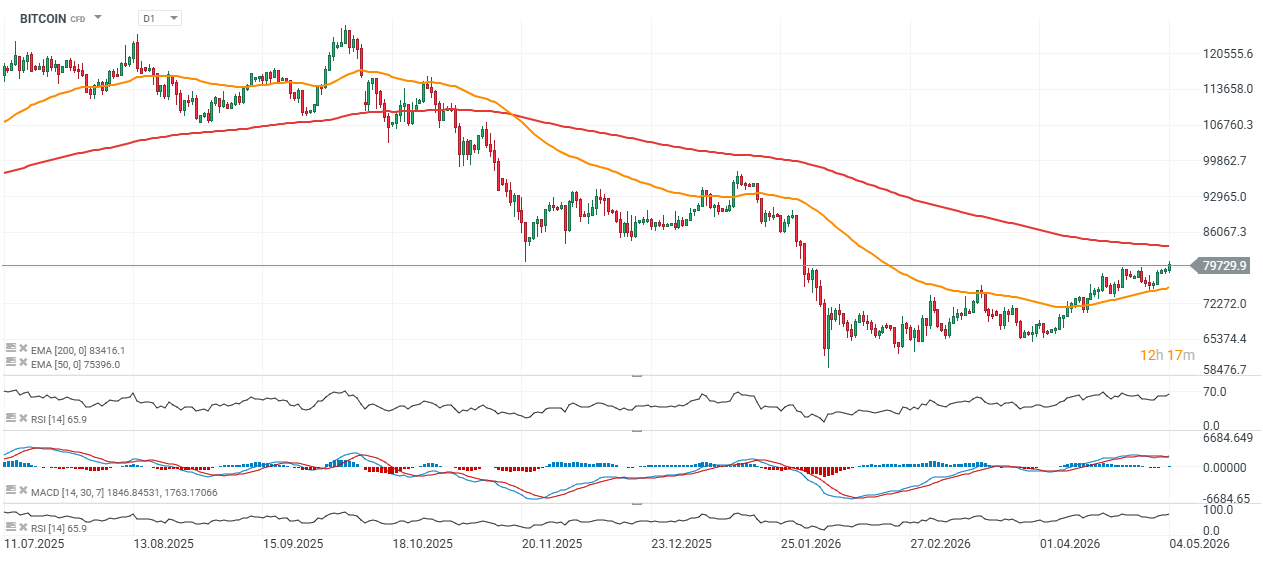
Looking at the chart, the current rebound phase following the decline is clearly longer than the previous one, and its percentage range is also greater. However, this alone does not guarantee a return to an uptrend. The $82–83k zone, where the 200 EMA (red line) is located, may prove to be a निर्णujący resistance area in the event of a more durable break above $80k. At this stage, the rebound still appears fragile, while the 14-day RSI has risen above 65.
Source: xStation5
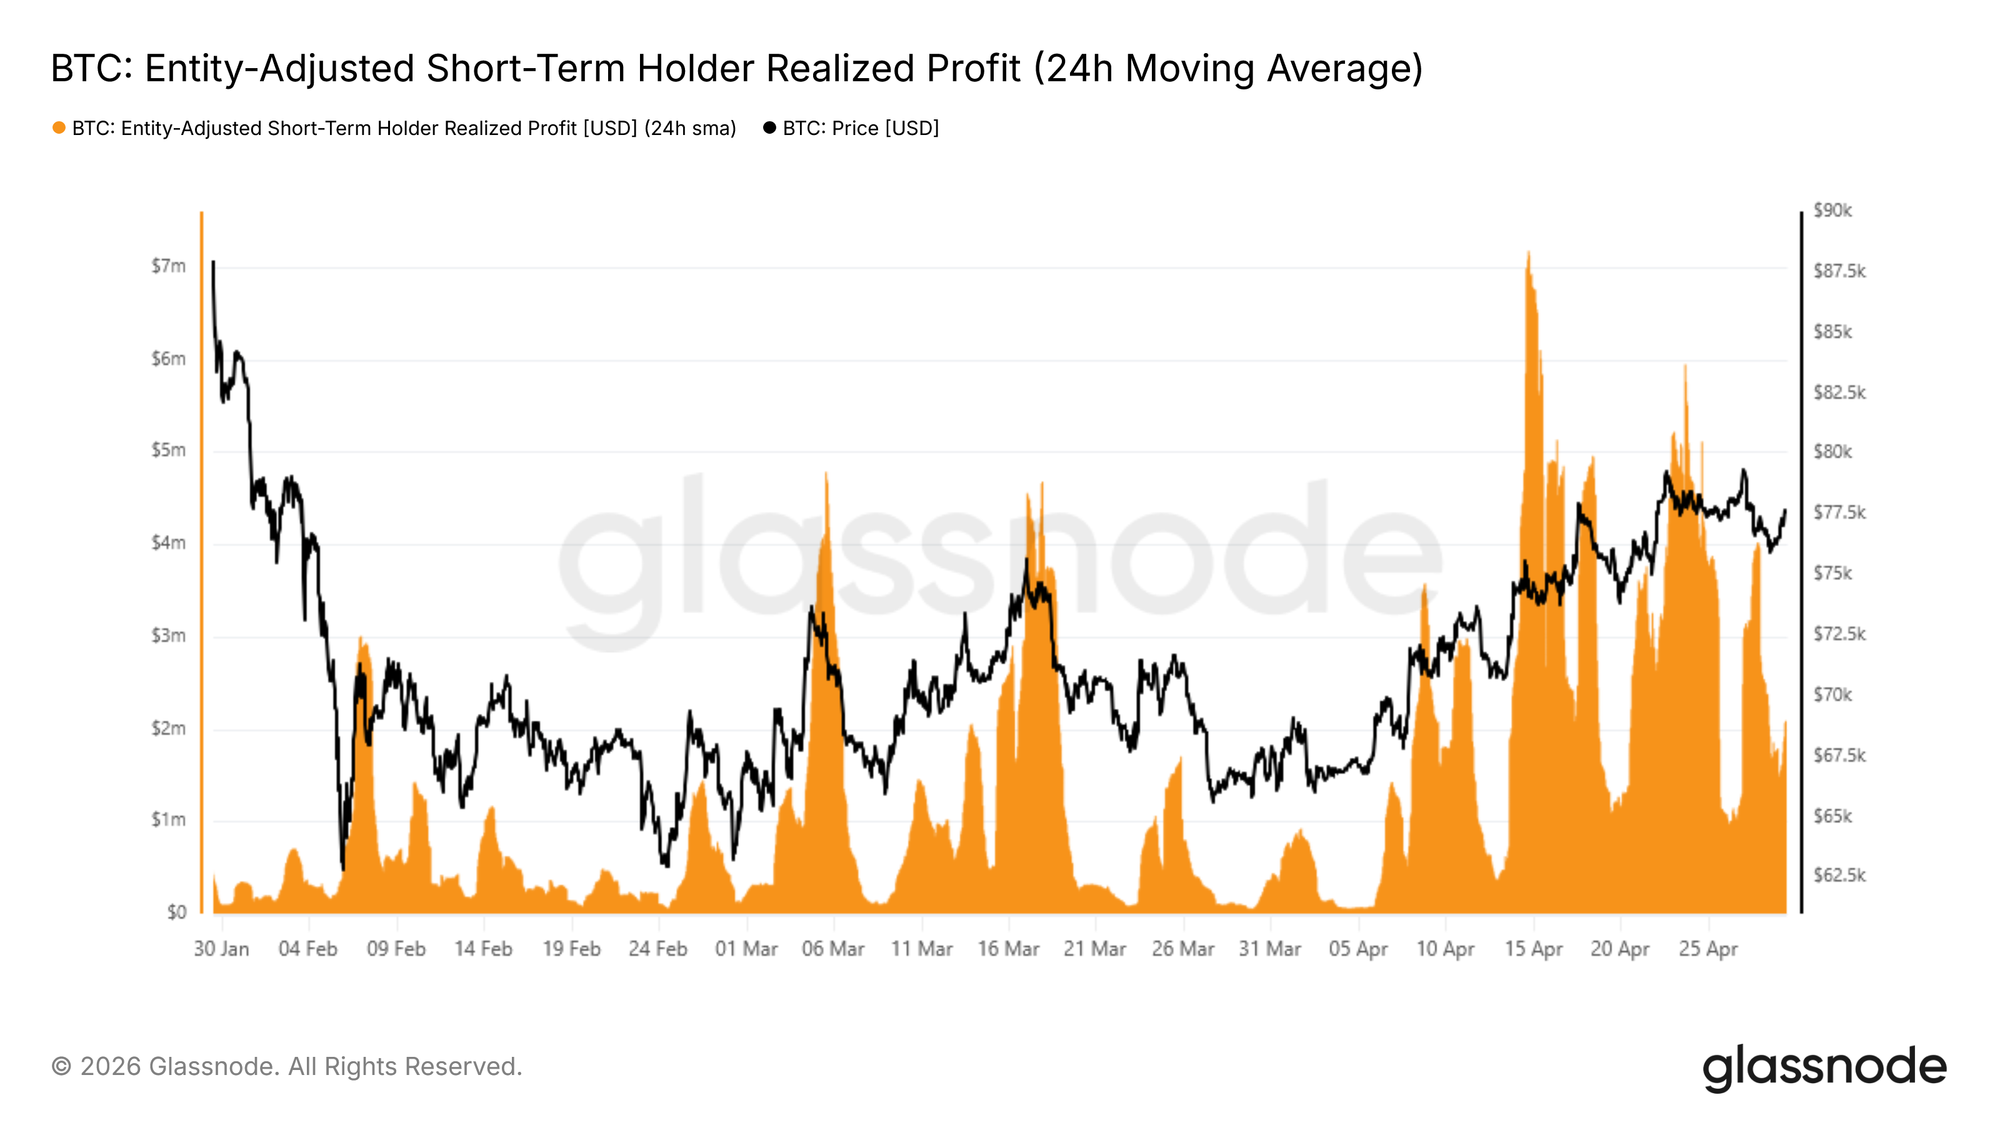
The recent slowdown in Bitcoin’s upward momentum around the short-term holder cost basis has been confirmed by on-chain data. As the price approached $80k, short-term holders began aggressively realizing profits. The 24-hour SMA of STH realized profit surged to approximately $4 million per hour — around four times higher than the baseline observed since mid-April. Short-term investors used the rally as a selling opportunity, while demand lacked sufficient liquidity to absorb this wave of profit-taking. The question remains: will this time be different?
Source: Glassnode
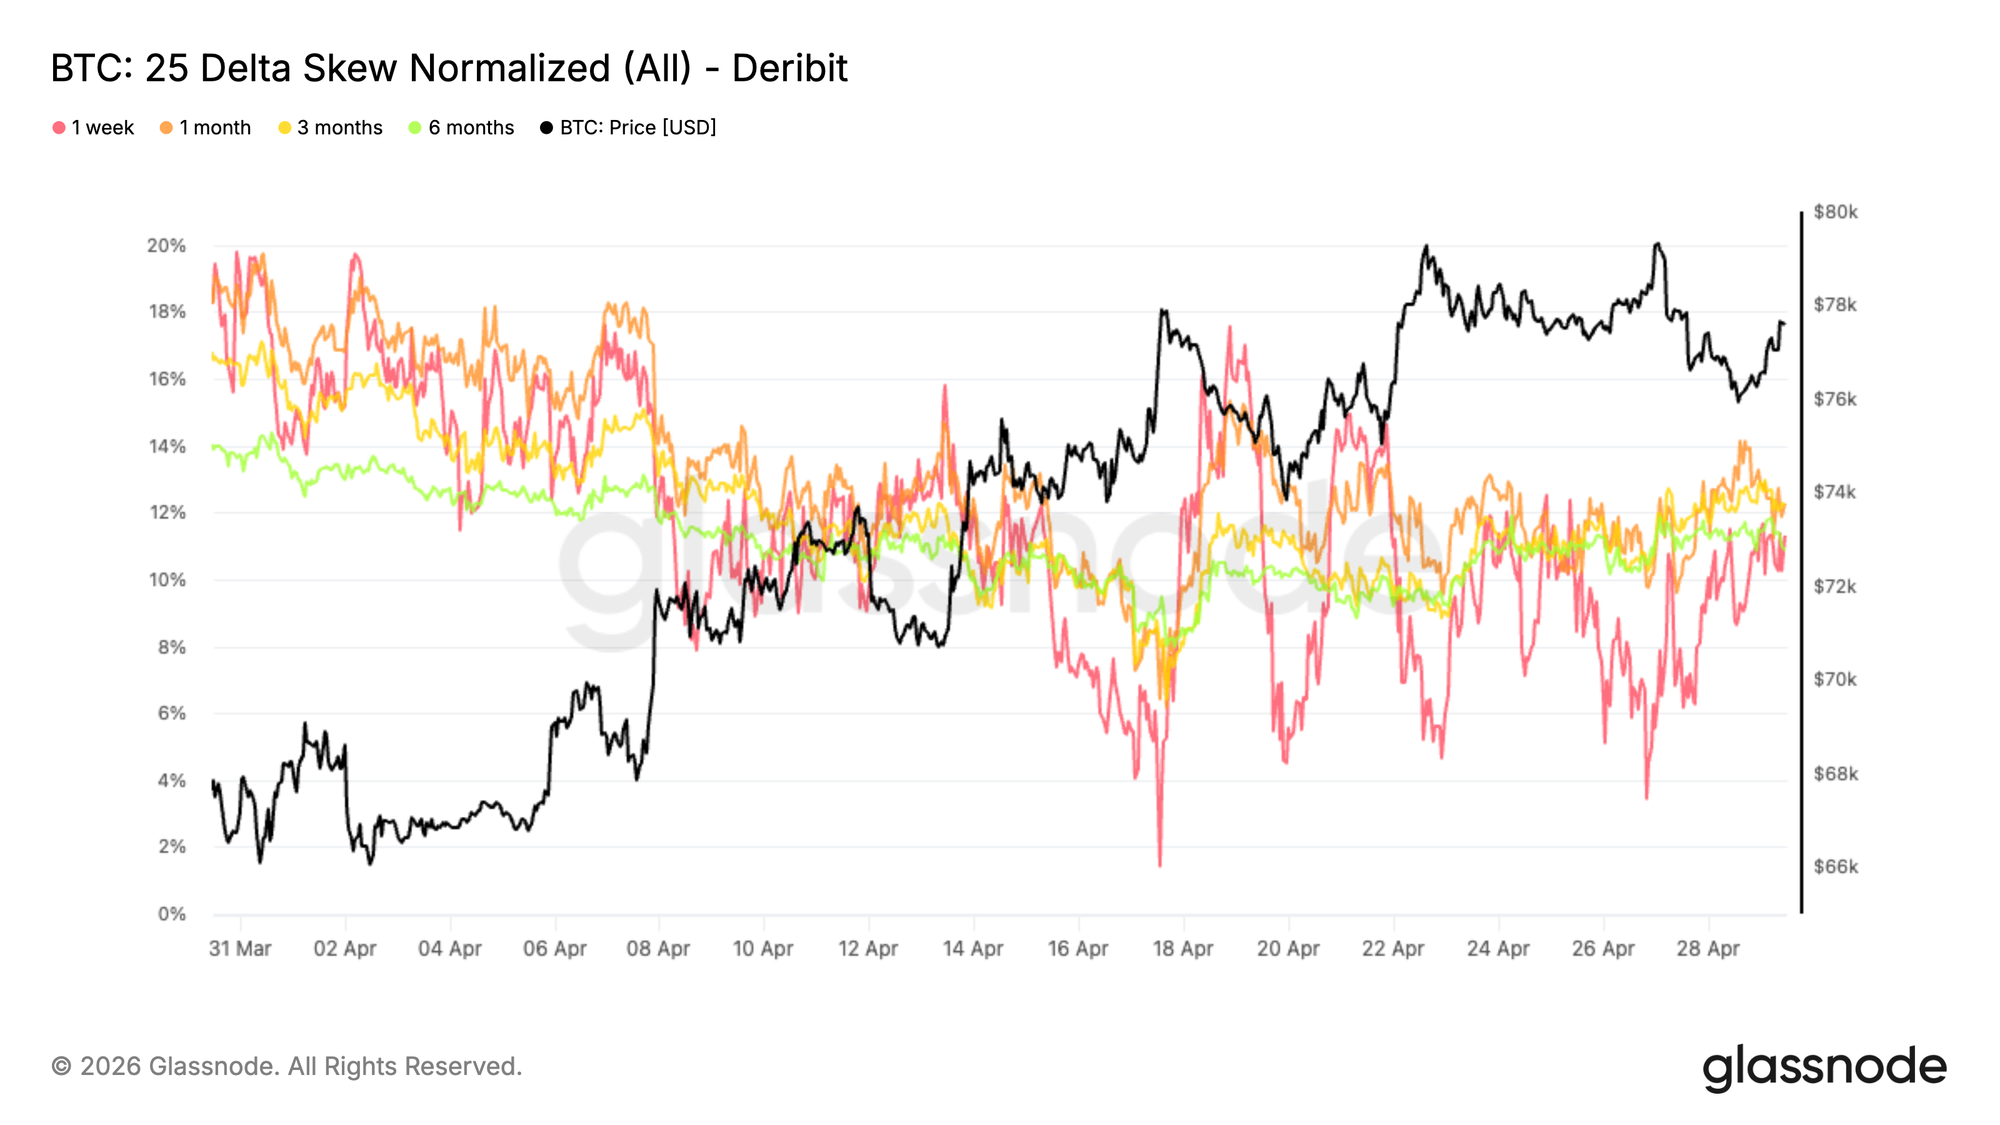
Following the decline in implied volatility, the 25 Delta Skew illustrates how demand for protection evolved throughout April. The overall trend shows a decline in put premium, with the 1-month skew falling from around 18% to 12%. This reflects reduced demand for downside hedging as market conditions stabilized.
At the short end, the 1-week skew has been more reactive, repeatedly moving toward neutral levels of 2–4%. These moves were largely tactical, with pullbacks used to buy calls and sell downside protection. More recently, as the price approaches the $80k resistance, demand for puts has increased again. This has pushed skew back toward the 11 - 12% range across maturities. The market continues to maintain downside protection — reacting tactically in the short term while remaining cautious further along the curve.
Source: Glassnode
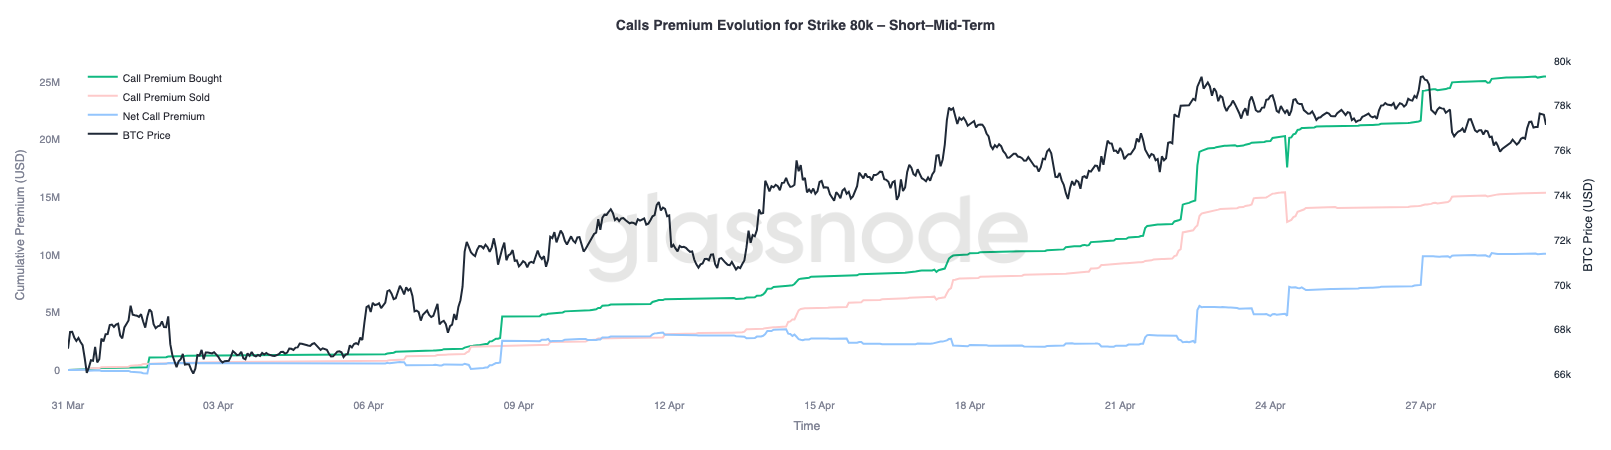
With declining volatility and lower skew, the market is increasingly focused on positioning, with the $80k level emerging as a key pivot. Sustained demand at the 80K strike across short and mid-term maturities suggests growing interest in upside exposure, rather than positioning for a rejection at resistance.
Key short gamma zones are located at $76k on the downside and $82k on the upside. In these areas, hedging flows can amplify price movements, especially in a low-liquidity environment. A break above $80k could bring spot closer to the $82k zone, where short gamma may force dealers to buy into strength, reinforcing the move. Positioning remains cautious, but the market is increasingly exposed to a sharper upside reaction if resistance is cleared.
Source: Glassnode

BREAKING: Iran attacks US ships? Oil prices surge

💶Eurozone Industry: A Fragile Recovery Masking Stagflationary Risks
Chart of the day: EURUSD (04.05.2025)

Economic Calendar: PMI data in the spotlight; this week’s corporate calendar ⬇️