
Oil giants Chevron (CVX.US) and Exxon Mobil (XOM.US) today presented excellent reports for the third quarter of the year. The results exceeded analysts' already very optimistic expectations. The stocks of both companies gained nearly 3% in pre-opening trade and are pushing to historic highs:
Exxon Mobil
Revenues: $112.07 billion vs. $102.96 billion forecasts
Adjusted earnings per share (EPS): $4.45 vs. $3.89 forecasts
Net income: $19.6 billion vs. $6.7 billion in Q3 2021
Cash flow (cash flow): $27.1 billion
Costs: $86.6 billion (up 35% y/y)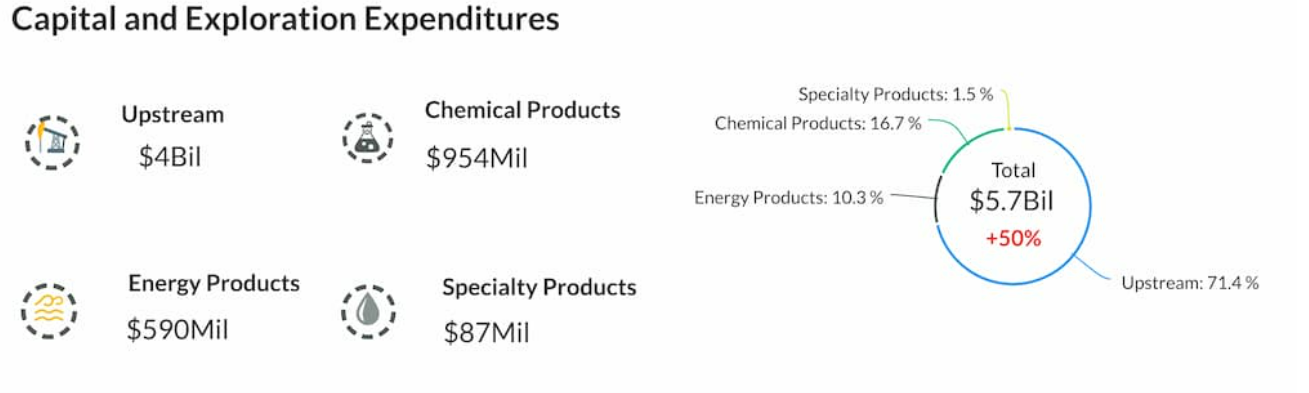
The company increased revenue from upstream (exploration and production) and downstream (production and supply) operations. Source: ExxonMobil
- The company's shareholders will receive a dividend of $0.91 per share on December 9, in the fourth quarter of FY 2022
Chevron
Revenues: $66.64 vs. $61.44 forecasts
Adjusted earnings per share (EPS): $5.56 vs. $4.94 forecasts
Net income: $11.2 billion vs. $11.6 billion in Q2
Downstream revenue: $2.53 billion vs. $1.95 billion forecasts
Upstream revenue: $9.31 billion vs. $8.13 billion forecasts
EPS year-over-year: $5.78 vs. $3.19 in Q3 2021
Cash flow: $15.3 billion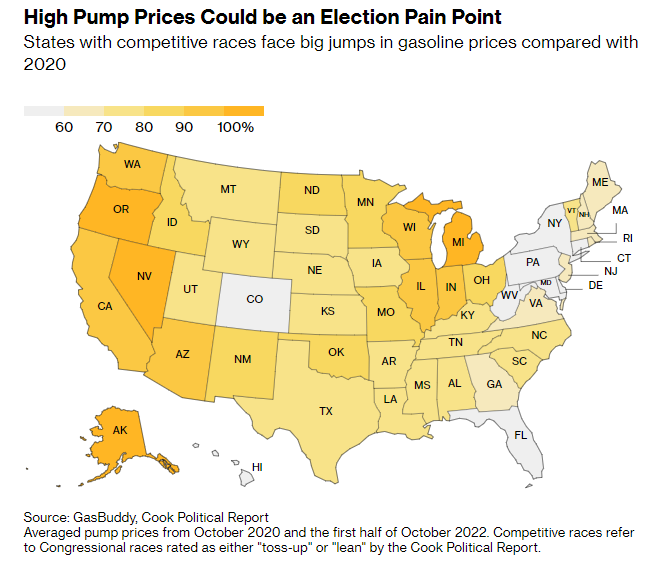 The average increase in gasoline prices is a major concern for Democrats ahead of the midterms elections for Congress. In the first half of October this year, the scale of the increase exceeded 70% in most US states compared to October 2020. Gasoline became most expensive in the states of Michigan, Oregon and Nevada. Source: GasBuddy, Cook Political Report
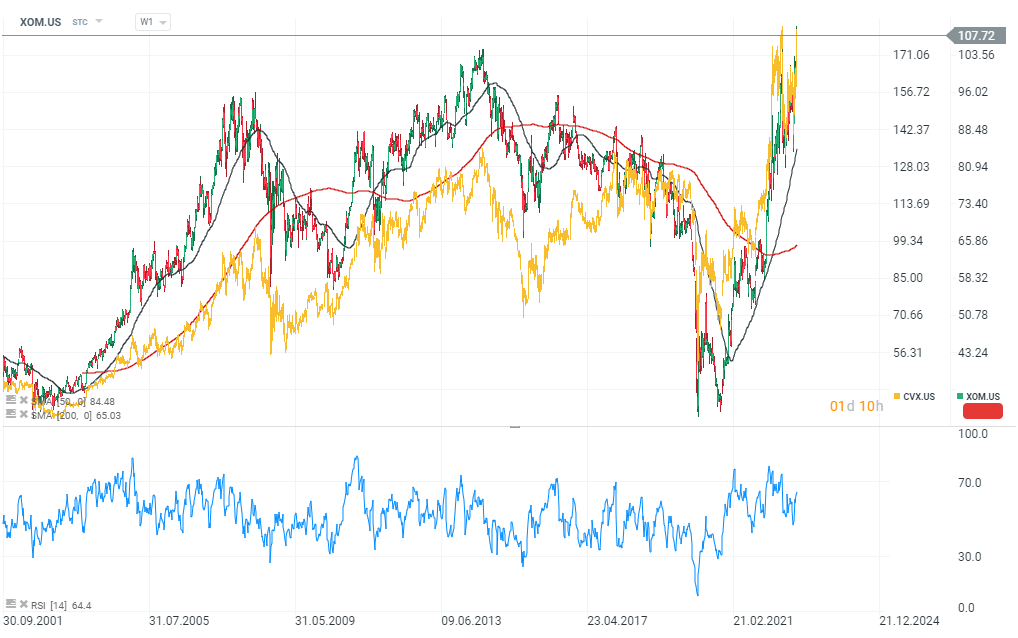 ExxonMobil (XOM.US) and Chevron (CVX.US) stock charts, W1 interval. Oil company stocks are highly correlated with oil prices. Higher GDP readings in the economies 'dismiss' to some extent the still lively fears around a global recession. The vision of an economic slowdown is limiting the growth of oil prices. Nevertheless, 'black gold' is already trading near $100, the latest DoE report indicated higher oil reserves and a surprising decline in gasoline and distillate stocks. OPEC+ production cuts may 'help' oil overcome the $100 resistance. The RSI relative strength index indicates levels at 64 points. These levels are far from the RSI's historical peaks, although both companies are trading at ATH. Source: xStation5

Daily Summary: Equities Diverge as Tech Lags, Europe Rallies on Earnings & PMIs (24.07.2026)

US OPEN: Nasdaq hits 1-month low! Geopolitics bring AI trade down!

Market Wrap: European Stocks Are Trying to Rebound as the Week Comes to an End💡

Alphabet shares are down 22% from their all-time high 🚩 Is Google ready to resume its bull run?