
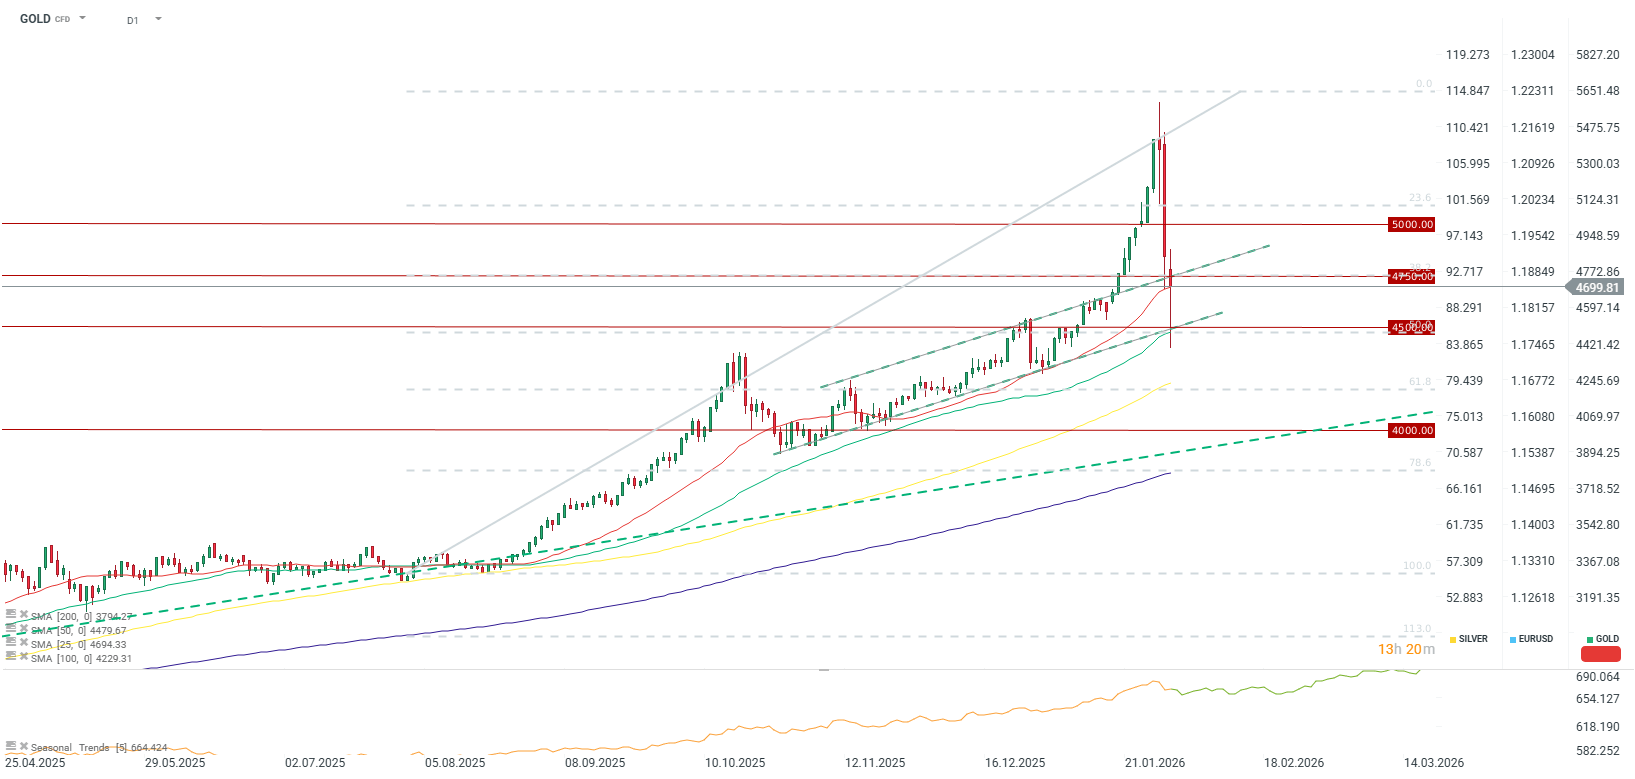
The gold price is significantly paring its losses, rebounding from near $4,400 per ounce to a level of almost $4,700. Notably, this bounce occurred around the 50.0 Fibonacci retracement level of the bull run that began in August 2025. Furthermore, the buffer zone between the 25 and 50-day Simple Moving Averages (SMA) remains intact for the time being.
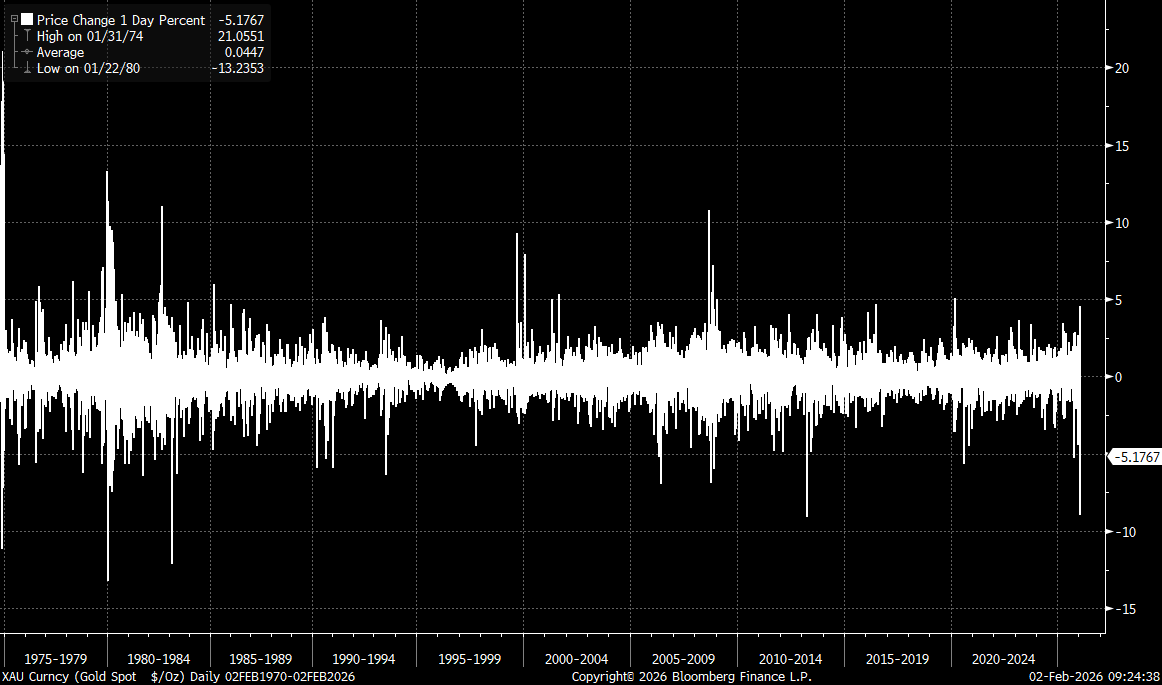
Friday’s price drop in the gold market was among the largest in history, yet it did not exceed 10%. By contrast, silver’s decline at one stage surpassed 30%. Source: Bloomberg Finance LP
It is important to highlight that the demand structure for gold differs fundamentally from that of silver. In the gold market, we have not observed the same extreme signals from the options market, nor were there acute concerns regarding physical bullion delivery. Nevertheless, historical context is vital: in the past, gold corrections from all-time highs have reached as much as 40%, although the largest correction since 2020 has been limited to 20%.
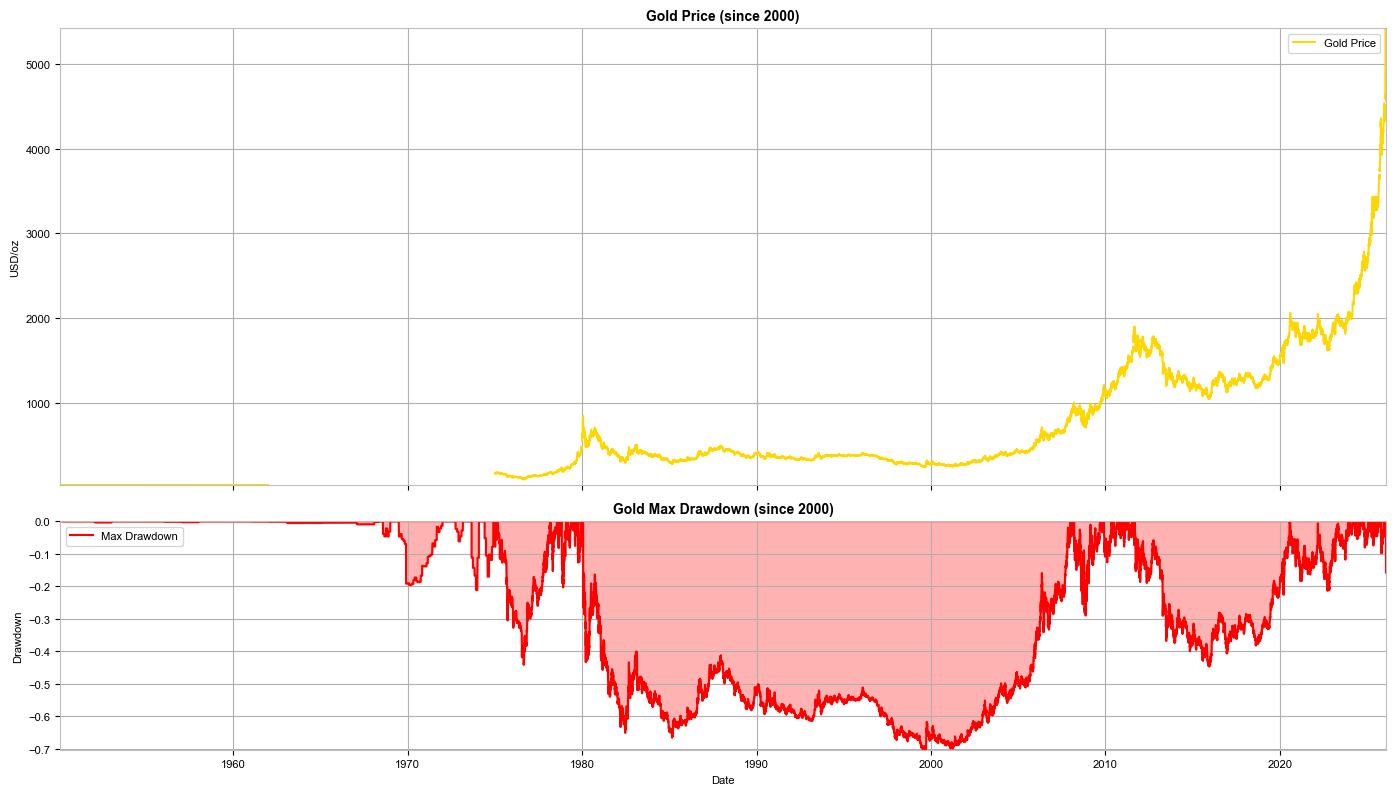
Analyzing the period from 2020 onwards, the maximum correction reached 20%. Source: Bloomberg Finance LP
A daily close above $4,750 per ounce could signal that the correction in the gold market has run its course. In such a scenario, the objective would be a swift return toward the $5,000 psychological barrier. Conversely, should gold end the session closer to $4,500, the prospect of a deeper correction remains on the table. This could see prices retreat toward the long-term trend line, situated in the $4,000–$4,200 per ounce range.

Tech sector catches its breath 🚀

Red Sea, but not the indices : The effects of the Bab al-Mandab blockade.

US OPEN: Semiconductors drive a rebound
Market Wrap: Bulls Return to Europe Thanks to U.S.-Iran Mediation and Data from Germany