
The volatility in the gold market has recently declined and the precious metal has been trading in a local sideways move. However, looking at the H4 interval, one can see that price is once again testing the major resistance at $ 1900, which increases the risk of a breakout. In such a scenario, a way towards further increases will be opened. Gold would then have a lot of room to strengthen as the next important resistance level is located at $ 1955,00. On the other hand, if sellers manage to halt advances here and break below the lower limit of the triangle pattern occurs, declines may deepen towards the $ 1,850,00 level, which is marked with earlier price reactions and lower limit of the 1: 1 structure.
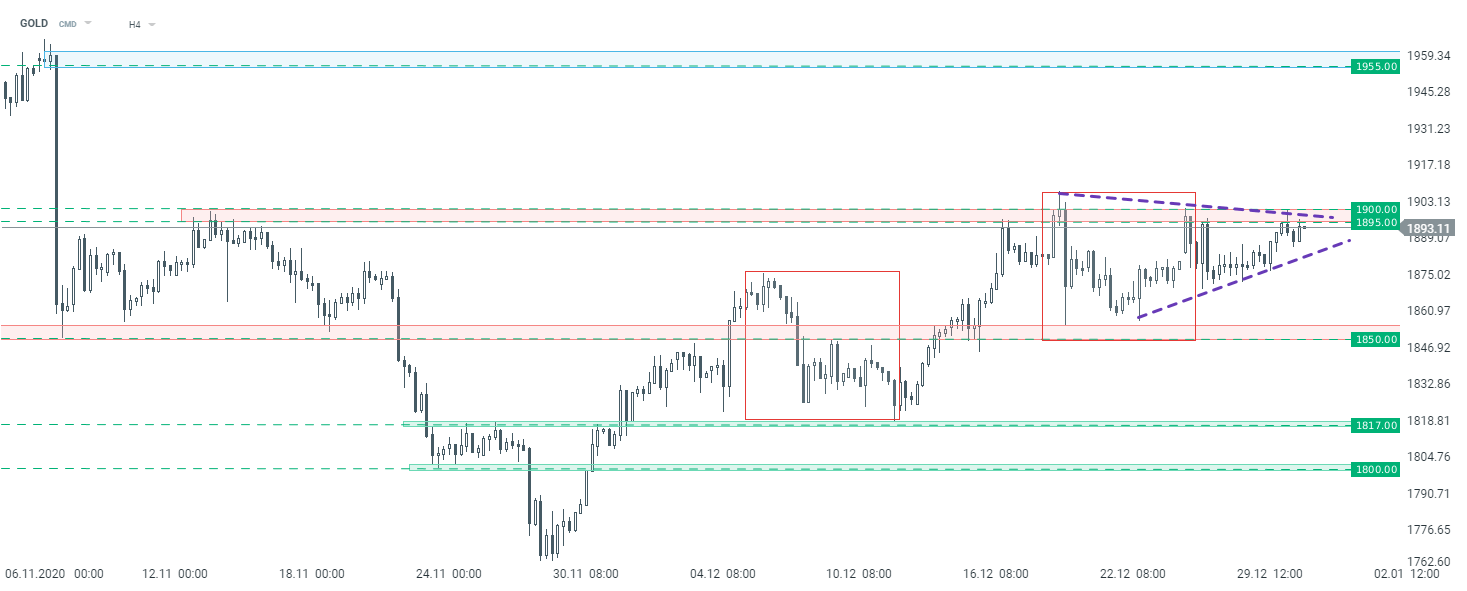 Gold interval H4. Source: xStation5

Daily Summary: The week ends on a positive note. SK Hynix up 14% on Nasdaq. Energy down (10.07.2026)

Three markets to watch next week (10.07.2026)

BREAKING: Iran and US are back at the negotiation table?! Oil takes a step back, stocks tick up!

Daily Wrap: Technology Leads Wall Street Higher. Markets Shrug Off US–Iran Tensions