
Major data from the US labour market will be released next Friday. Despite rising inflation, the Fed is using the weaker NFP report as an excuse to postpone the so-called tapering, i.e. the process of reducing asset purchases. However, in the face of strong NFP data, bankers may run out of arguments to maintain current policies, which in turn may cause greater volatility on the markets.
TNOTE
As for the TNOTE market, the recent rollover slightly distorted the chart, but on the D1 interval it can be seen that the market was actually consolidating since the beginning of March. If Friday's NFP data cause more movement in the bond market, it may also translate into higher volatility in the stock, dollar or gold markets. Technically looking at the TNOTE chart, the key support is located around the recent lows at 130.80, while the resistance lies at 133.6. The line along the last lows and highs should also be taken into account, as it was respected by the market and should act as the nearest obstacle for market bulls.
 TNOTE interval D1. Source: xStation5
GOLD
Gold has been in an uptrend since the beginning of April. In recent days, the upward movement has slightly decreased, but it is definitely too early to think about a change of direction. It is worth noting that the first Fibonacci measurement - 23.6% is relatively far away, which proves the strength of the trend (shallow corrections and strong upward impulses). The nearest support is the sequence zone at $ 1,890, followed by the $ 1,879 level, which is marked with the lower limit of the 1:1 structure. The aforementioned Fibo levels should also be considered as support levels. The closest resistance lies at $1,916.
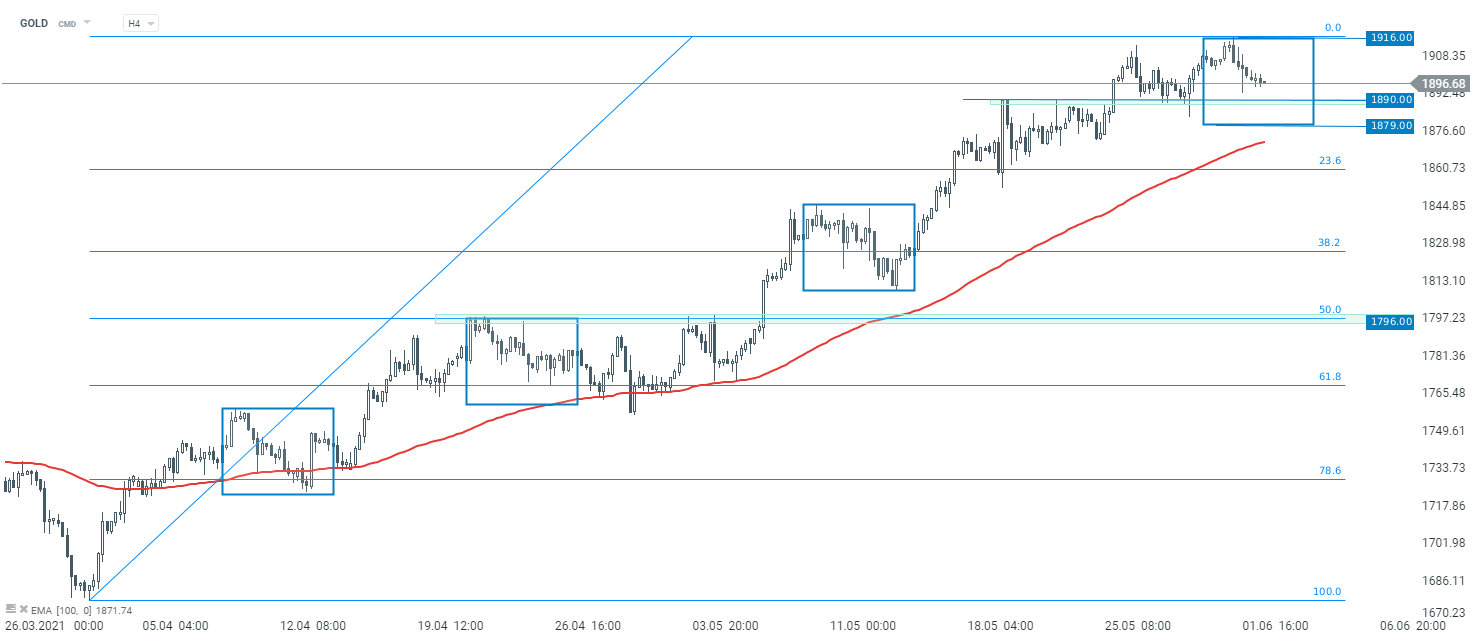 Gold interval H4. Source: xStation5
US100
Looking at the stock market, the US Nasdaq (US100) has been consolidating for a week. Buyers tried unsuccessfully several times to break above the resistance at 13,730 pts. If the correction deepens, then it is worth paying attention to the support at 13555 pts, which is marked with the lower limit of the 1: 1 structure and EMA75. Break below this zone could open the way towards support at 13,420 pts. On the other hand, if buyers manage to break above the aforementioned resistance at 13,730 pts at the next attempt, then upward movement may become stronger. In such a scenario, the next noteworthy resistance lies quite close - at 13,800 pts. Breaking above it could pave the way towards all-time highs at 14060 pts.
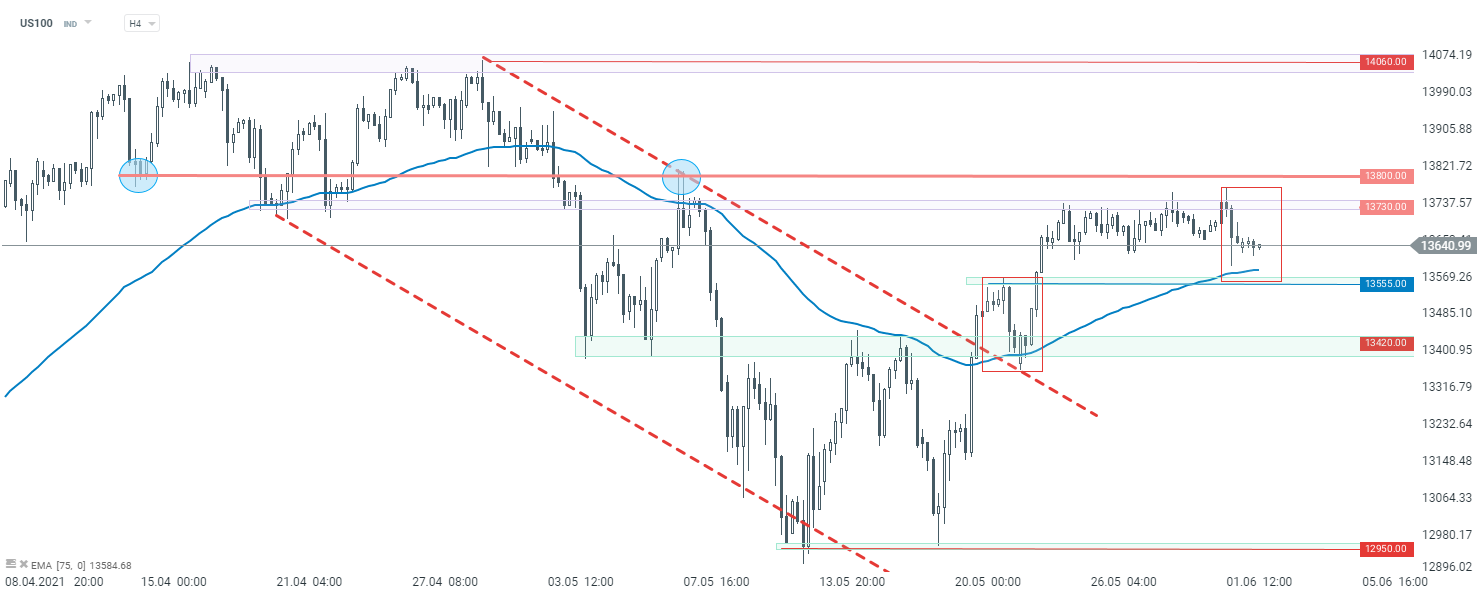 US100 interval H4. Source: xSation5

Morning Wrap: Markets Are Trying to Rebound Following Big Tech Earnings and the Fed's Decision

Daily Summary - The market starts to doubt rate hikes after Warsh, but Trump destroys the rebound

Fed Press Conference: Warsh Praises CapEx and Improves Market Sentiment

Strong Sell-off in Coffee and Cocoa