
-
Asian equities under heavy pressure: The MSCI Asia Pacific Index fell as much as 2.8%, marking the largest two-day decline since April.
-
Sharp sell-off in South Korea: The KOSPI index dropped as much as 6.8% after markets reopened following a long weekend, despite having been one of the best-performing indices globally earlier this year.
-
Western futures signal further downside: Equity-index futures in the US and Europe declined by around 1%, pointing to a potential continuation of the correction.
-
Iran–US/Israel escalation pushes oil higher: Investors are focusing on supply risks, particularly after Iran threatened to close the Strait of Hormuz, a critical global oil transit route.
-
Brent back above $80 per barrel: Oil prices once again moved above $80, following a “moderate” surge of more than 7% on Monday.
-
US dollar strengthens: Rising risk aversion and geopolitical tensions are supporting gains in the US currency.
-
Bonds retreat despite safe-haven status: Higher oil prices are reviving inflation concerns, lifting rate expectations and weighing on global fixed-income markets.
-
Government debt sell-off from Sydney to Tokyo: Investors are offloading sovereign bonds amid fears that a prolonged Middle East conflict will sustain inflationary pressure.
-
Broad-based bond declines: Government bonds in the US, Japan, Australia, New Zealand, and South Korea are all posting losses this week.
-
Inflation back in focus: Markets are once again pricing in the risk that elevated energy costs could undermine the outlook for global bonds, which had previously recorded their strongest start to a year since the pandemic.
-
Trump comments on the Iran conflict: The former US president stated that the largest US strike may still be ahead, did not rule out a ground operation, and emphasized that with current military capabilities and industrial strength, the US could sustain a prolonged and ultimately victorious war.
-
TTF futures jumps: futures on European natural gas TTF surges more than 20% today after yesterday almost 50% jump driven by supply halt in Qatar.
OIL (D1 timeframe)
Looking at the Brent crude futures chart, we can see that the EMA200 and EMA50 have formed a technical “golden cross,” which may signal a more sustained bullish impulse, as the 50-period moving average has crossed above the 200-period average from below.
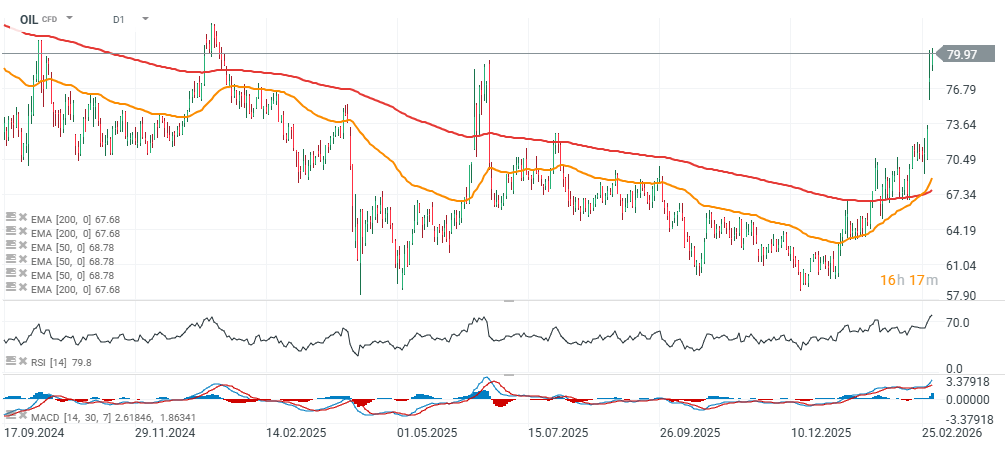
Source: xStation5

Daily Summary: Wall Street Regains Ground; Another Intervention in the Yen Market❓

Three Markets to Watch Next Week (July 31, 2026)

Market Wrap: European equities at 3-week highs! Apple dips in US premarket!

Euro Area core inflation above estiamtes! EURUSD under key resistance!