



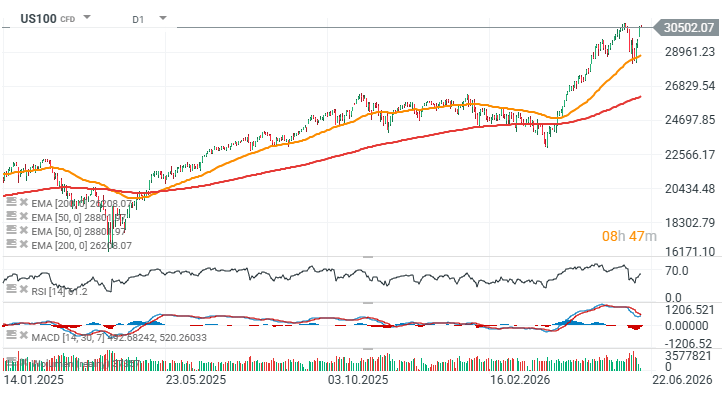
From a technical analysis perspective, the uptrend remains firmly intact. However, the pace of the rally over the past few sessions raises some questions. Since 11 June, the index has gained nearly 2,200 points, a move that appears unusually strong by historical standards. At the same time, both the RSI and MACD indicators on the daily chart have been trending lower since May, creating a bearish divergence with price action.
While it is impossible to predict whether the US100 will surpass its early-June record, the index is currently only around 300 points away from that level, suggesting that market sentiment may be approaching euphoric territory. Ahead of the US market open, futures are trading slightly lower on an intraday basis.
Source: xStation5



Three markets to watch next week (23.10.2026)



Daily Summary: Oil at five-month highs, indices under pressure (23.10.2026)

US Open: Further declines on Wall Street, Brent above 111 USD, AI correction continues (14.10.2026)

Chart of the Day: Is USDJPY running out of road? Inflation forces the BoJ to act, but the Fed could spoil the Yen’s rally