



Recent temperature forecasts in the US indicate that a slightly colder period is ahead, which in theory should contribute to higher gas prices. Nevertheless, as we can see from today's session, NATGAS is trading under the dash. At one point, losses were as high as 6%, and currently they have been limited to around 4%.
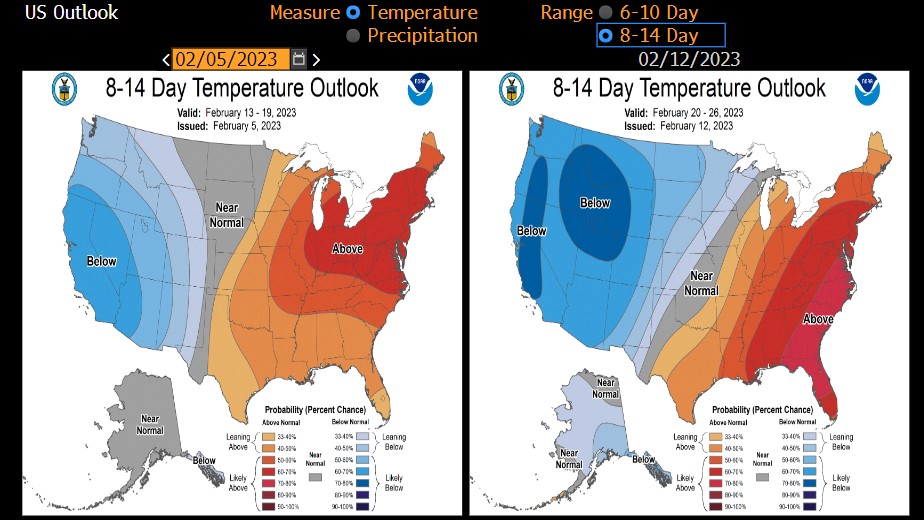 US temperature forecasts for the next 8-14 days point to a cooling. Source: Bloomberg
Looking technically at the NATGAS chart on the H4 interval, the stock has been moving in a downtrend for quite some time. At the moment, there have been no signals to suggest a change in sentiment. The key in the short term appears to be the EMA50 average, marked in purple, from which the price has bounced several times in the past. Despite the clear flattening out of the downtrend, as long as the average is not broken, the downtrend remains in place.
 NATGAS H4 interval. Source: xStation5



Daily Summary: Investors Concerns Rise Ahead of Earnings Season


European gas at its highest level in 3 years🚨


US OPEN: Wall Street under pressure from oil and semiconductors


📊Market Wrap: Europe Rebouns Despite Higher Oil and Dollar (12.10.2026)