
Summary:
-
Weekly crude oil inventories: +8.0M vs -0.2M exp and -2.7M prior
-
Rise even larger than last night’s API reading though (+6.6M)
-
Despite this both Oil and Oil.WTI in the green after recent pullback
The latest inventory data for crude oil from the US has shown an unexpected build, but despite this the market has moved higher in the hour or so since in typically choppy trade. A reading of +8.0M is the highest since early November and the only sizable build in 8 weeks, as well as coming in well above the forecast 0.2M decline. Last week’s reading was -2.7M. The private API data often plays a significant role in shaping market forecasts and against this backdrop the build does appear a little less of a negative shock, with the latest API number showing a print of +6.6M.
The components of the report are as follows:
-
Gasoline: +4.1M vs +3.0M exp
-
Distillates: -0.6M vs +0.9M exp
-
Refinery utilisation: -1.7% vs -0.9% exp
-
Production unchanged at 11.9 mbpd
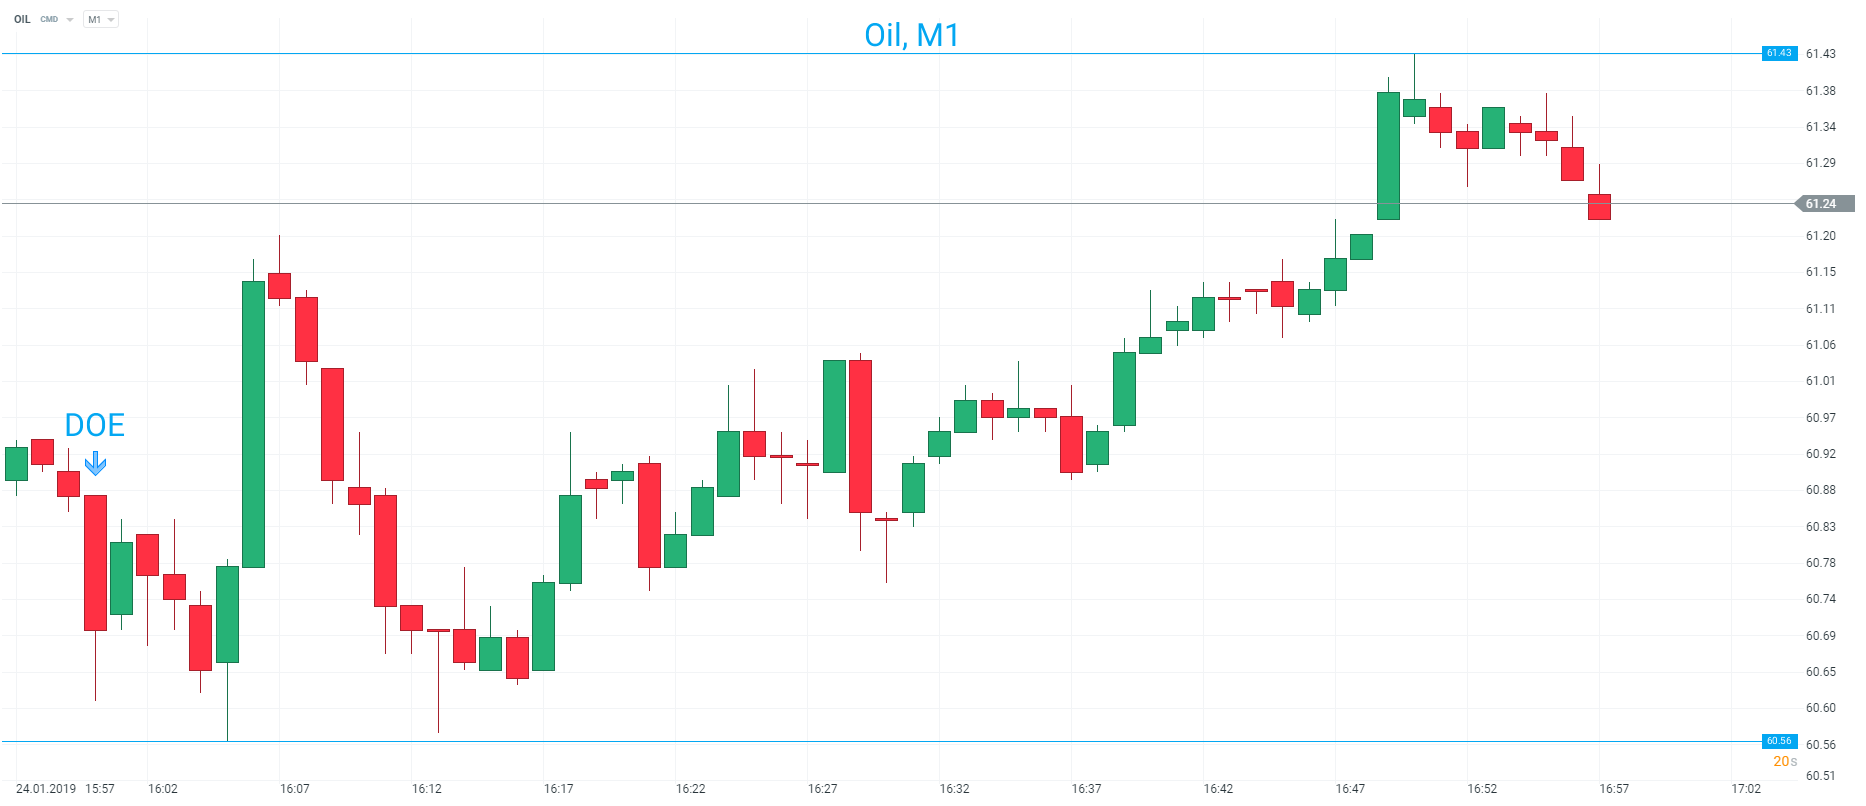
Oil has been pretty volatile since the release, but on the whole it is attempting to move higher with the market jumping almost 90 ticks from the lows since the data was released. Source: xStation
Longer term the outlook for Oil remains fairly constructive on daily charts despite the selling seen in recent sessions. The inverse head and shoulders formation previously identified may be looking to carve out the second shoulder with a possible neckline seen around the 63.75 level. Price has pulled back to the 8 EMA (blue line) but remains above the 21 EMA (yellow line) and while these remain in a positive orientation (IE 8 above 21) the the near-term trend continues to point higher.
 The Oil chart remains constructive with an inverse S-H-S possibly forming and the 8/21 EMAs in a positive orientation. 63.75 remains potentially key resistance. Source: xStation