-
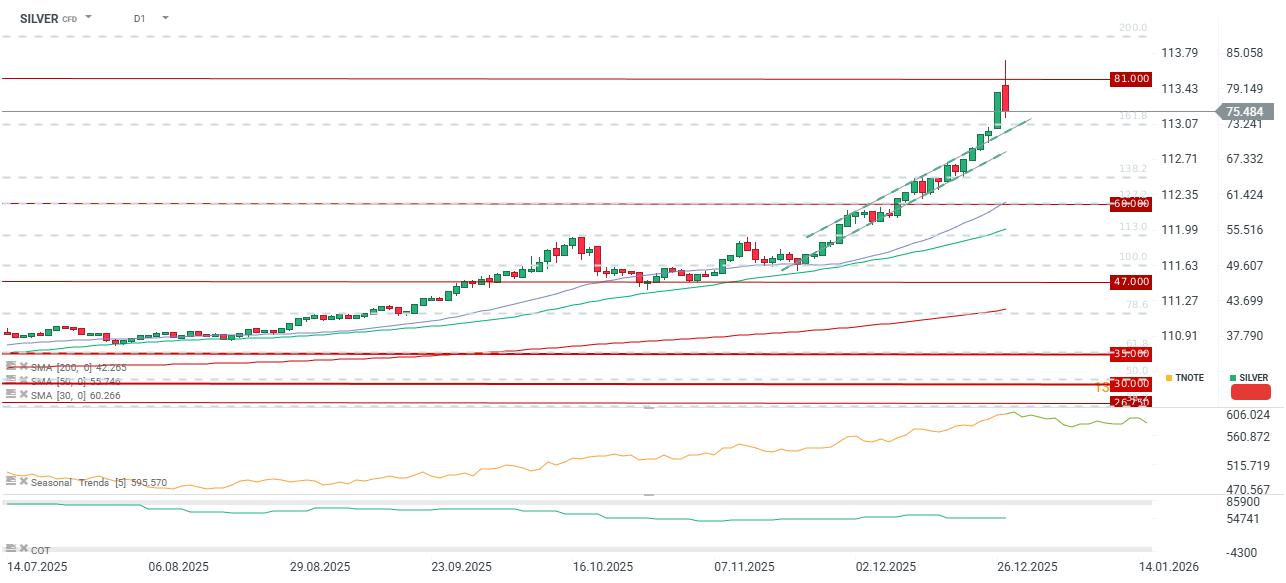
Silver charts an astronomical trajectory, gaining over 30% in the past month and surging more than 160% year-to-date.
-
During Friday’s session, while most global markets remained shuttered, COMEX prices touched a near-record $84 per ounce.
-
A correction toward $75 per ounce is currently underway, a move closely linked to aggressive margin hikes by major commodity exchanges.
-
Silver charts an astronomical trajectory, gaining over 30% in the past month and surging more than 160% year-to-date.
-
During Friday’s session, while most global markets remained shuttered, COMEX prices touched a near-record $84 per ounce.
-
A correction toward $75 per ounce is currently underway, a move closely linked to aggressive margin hikes by major commodity exchanges.
Robust fundamental drivers
The silver market is primarily defined by a chronic structural deficit, fueled by a sharp recovery in demand over the last several years. Robust consumption from the photovoltaic sector has met with an inelastic supply response; silver remained relatively undervalued for years, and recycling volumes saw only marginal increases. Crucially, silver is largely produced as a by-product of gold, copper, zinc, and lead mining. Furthermore, commissioning new mines typically requires over a decade of lead time and immense capital expenditure, leaving the global supply curve essentially flat for the past fifteen years.
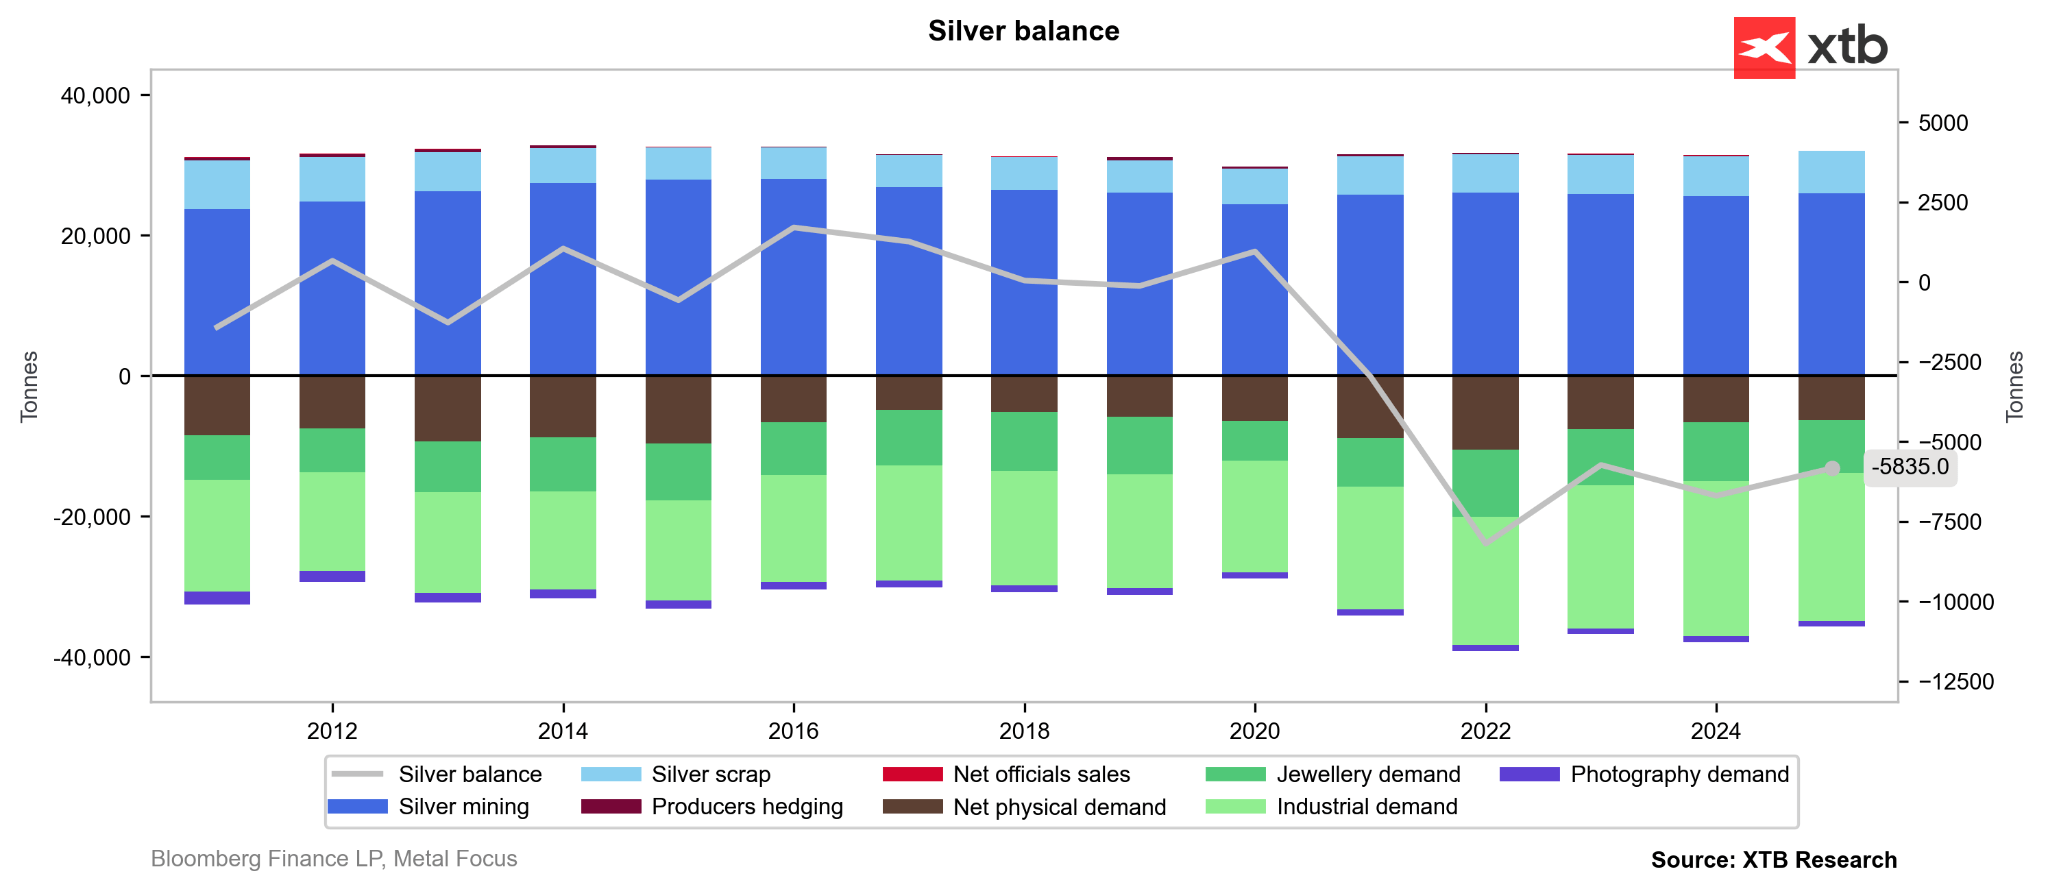
Persistent deficits: What has shifted?
A flight to safe-haven assets and loose monetary policy have propelled precious metals to record levels. Rising prices are attracting a broader investor base, including retail participants. Earlier this autumn, physical availability tightened across Asian markets. Simultaneously, a surge in ETF inflows has increased institutional participation. Speculative capital is increasingly favouring ETF-based derivatives over direct futures contracts.
This renewed ETF demand has resulted in a genuine physical squeeze. With industrial demand showing no signs of destruction, prices have undergone a violent repricing. While the influx of ETF capital introduces heightened volatility, the immediate catalyst for today’s retracement appears to be the regulatory intervention in the futures markets.
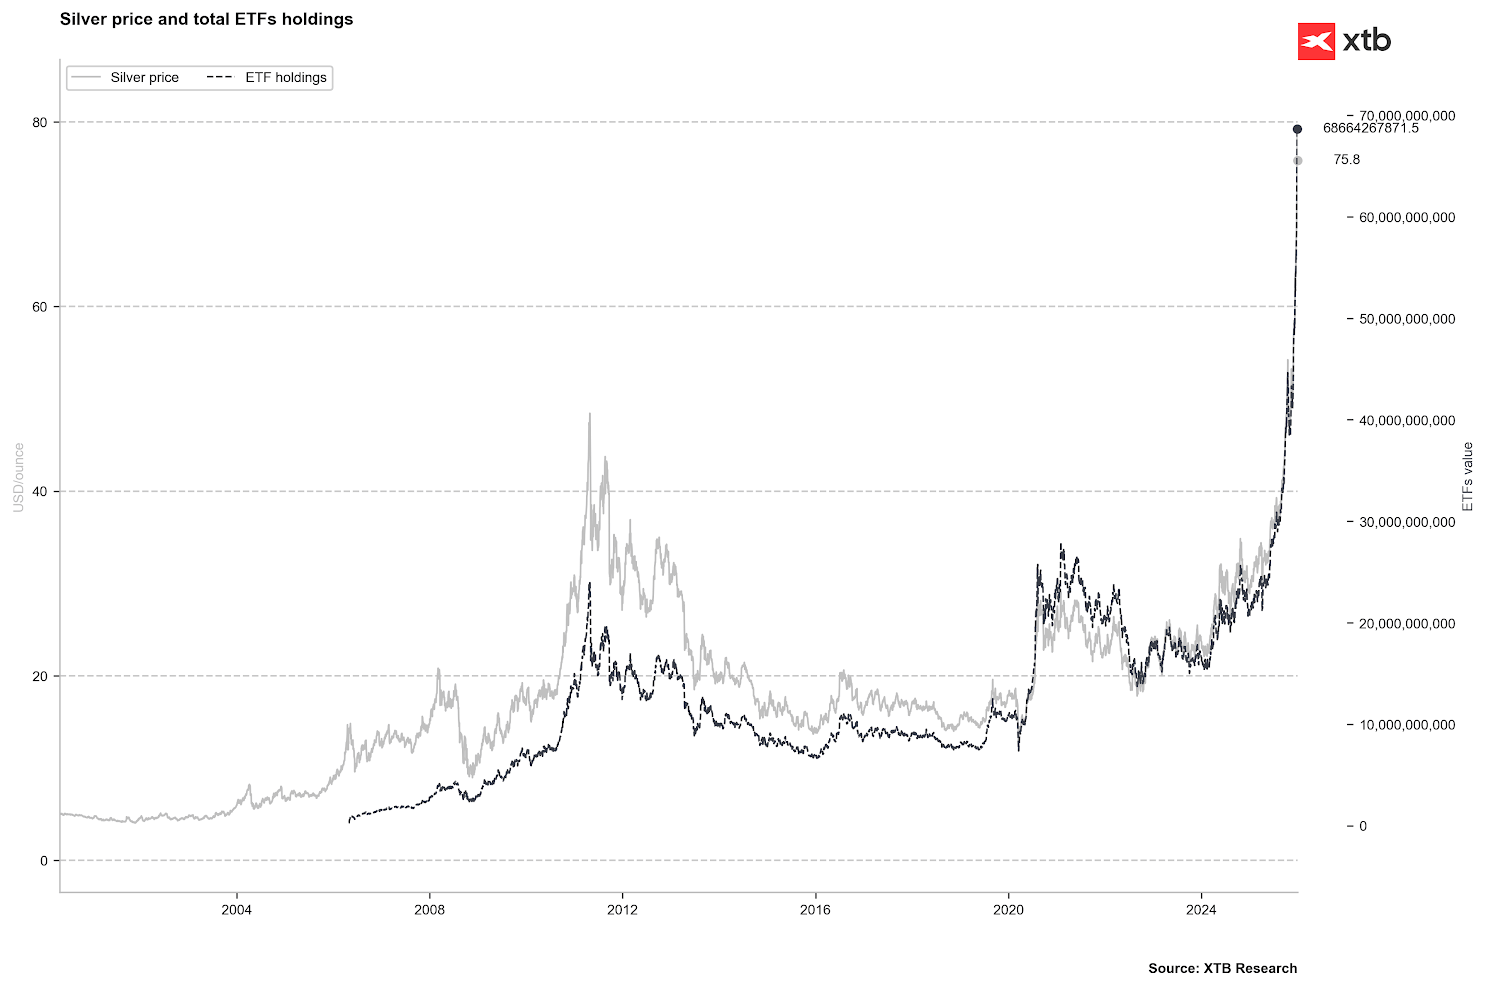
The value of silver held in ETFs has approached $70bn. This is more than double the peaks seen in 2011 and 2020. However, the physical volume of metal held by these funds remains below historic highs. Source: Bloomberg Finance LP, XTB
Regulatory intervention: Echoes of 2011 and 1980?
The recent price euphoria prompted the COMEX exchange to raise margin requirements for silver futures. An initial 10% hike took place on December 12. A more drastic intervention occurred on December 26—effective today, December 29—where the margin required to maintain a position rose by 25%, from $20,000 to $25,000 per contract. CME Group (the parent of COMEX) justified the move as an effort to align margins with rising volatility and mitigate counterparty risk.
While higher margins restrict speculative access, they do not alter the market’s physical fundamentals, though they do limit the liquidity of the futures market. Furthermore, recent trends show investors increasingly opting for physical delivery upon contract expiry, which drains exchange inventories. A similar dynamic was observed in the 1980s.
In 2011, silver tested the $50 per ounce level, matching records from the 1980s. This surge was driven by low interest rates, the Fed’s QE programme, and rising investment demand. The rapid price spike led to multiple margin hikes; the cost of carry practically doubled in days, forcing an investor exodus and initiating a protracted bear market that did not conclude until 2020.
Similarly, in 1980, COMEX intervention ended the speculative cornering of the market by the Hunt brothers. In that era, individual gold ownership was illegal, making silver the primary hedge against monetary devaluation. COMEX not only hiked margins but also imposed strict limits on the number of positions individual traders could hold.
While current conditions mirror these historical periods, today’s market is supported by a structural deficit and new geopolitical tailwinds.
Chinese export restrictions
While Mexico remains the top producer, China is regarded as the world’s most critical silver hub. Beijing is currently the second-largest producer globally, surpassing Peru, Chile, and Poland.
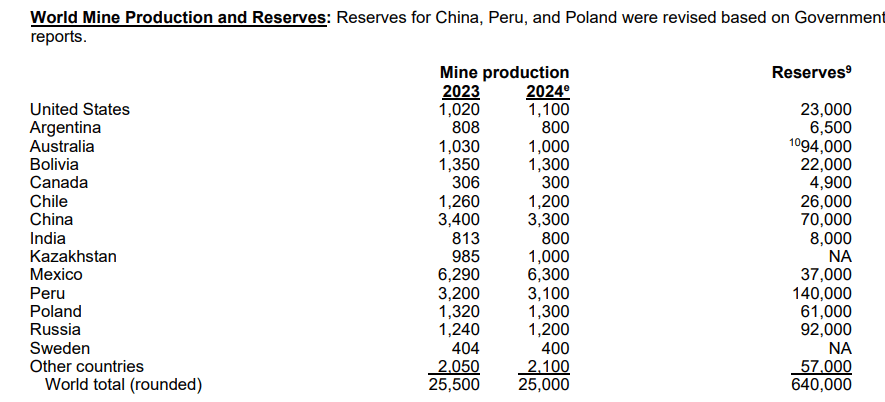
Global silver production and estimated reserves. Source: USGS
Given China’s significance as a refiner and exporter, the introduction of export curbs has added fuel to the rally. From January 1, 2026, exporters will require special licenses from the Ministry of Commerce. Furthermore, exporters must demonstrate an 80m tonne annual production capacity and maintain credit lines of at least $30m.
This move aims to restrict the outflow of metal. Elon Musk recently noted on X that China’s decision is concerning, as silver is essential to various industrial processes. Notably, the USGS added silver and copper to its list of critical raw materials this year.
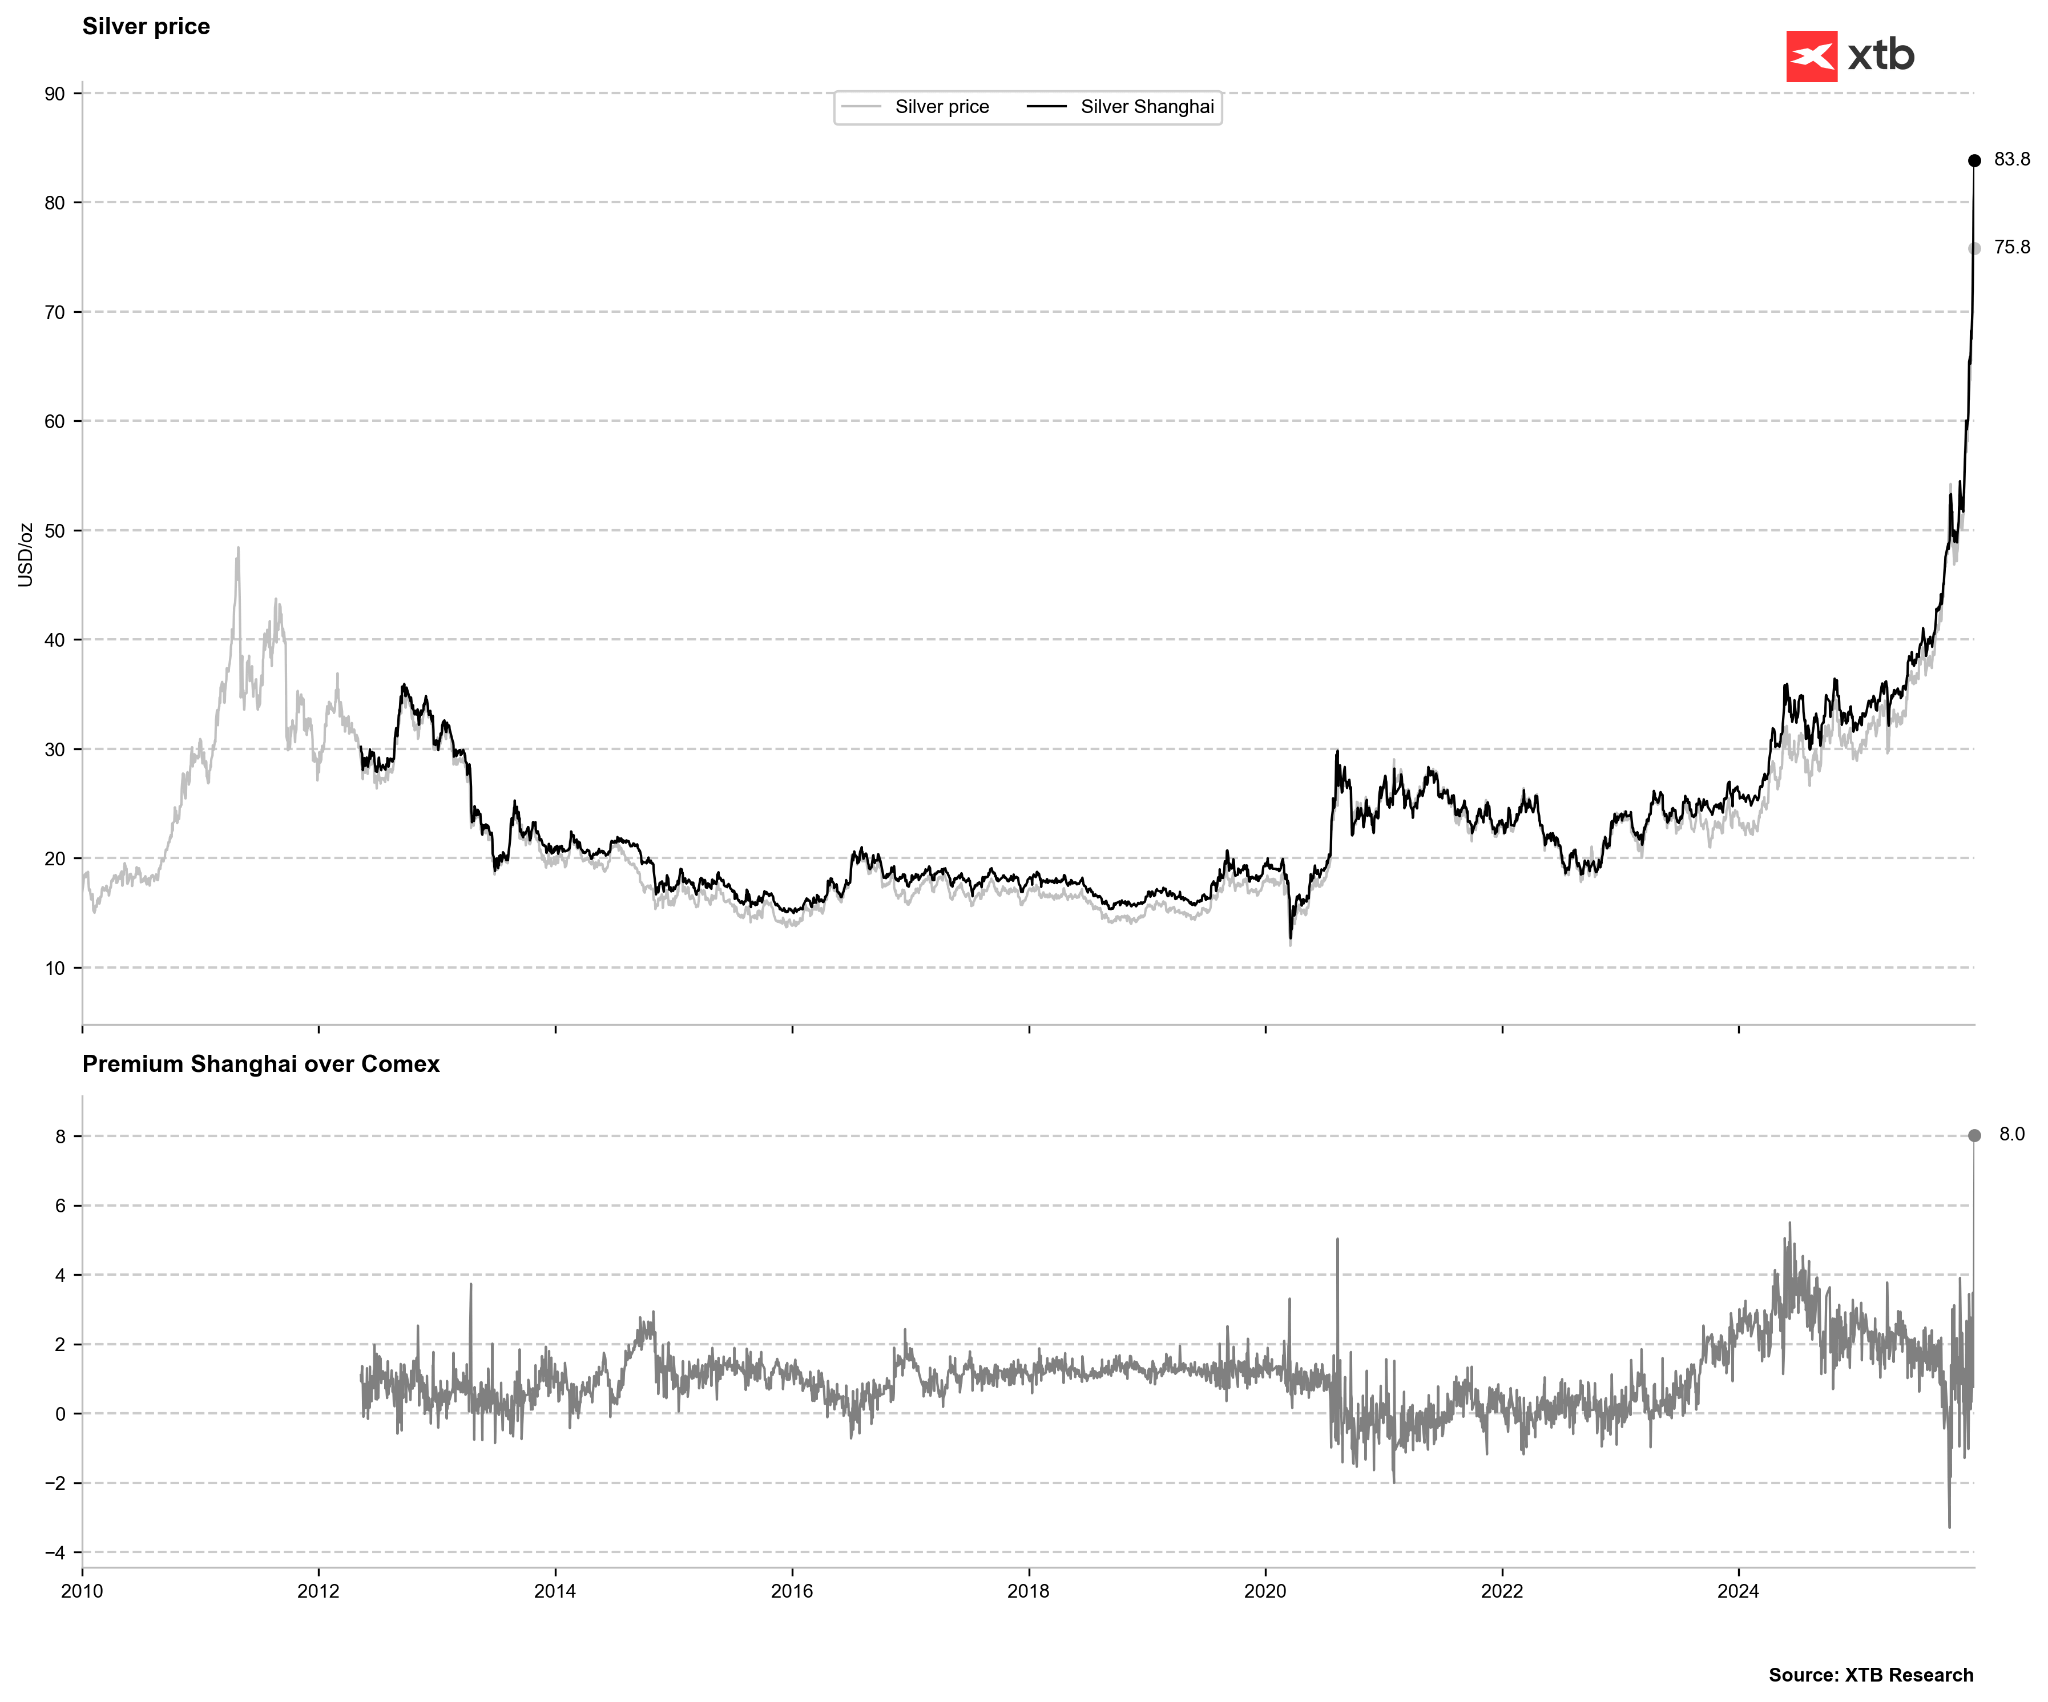 The price premium on the Shanghai Gold Exchange has surged to an extreme $8 per ounce. Historically, spikes to the $4–$5 range have signaled an overbought market. Source: Bloomberg Finance LP, XTB
Is there room for further upside?
The gold-to-silver ratio remains the benchmark for silver’s valuation potential. Having traded near 100 points earlier this year, the ratio is now approaching its long-term average of 53. While historical peaks in 1980 and 2011 saw the ratio drop significantly lower, the current rate of decline raises questions about how far below the average it can slip in the near term. If the ratio were to revert to the 35–40 range seen in 2011, a gold price of $4,500 would imply a silver valuation of $112–$128 per ounce.
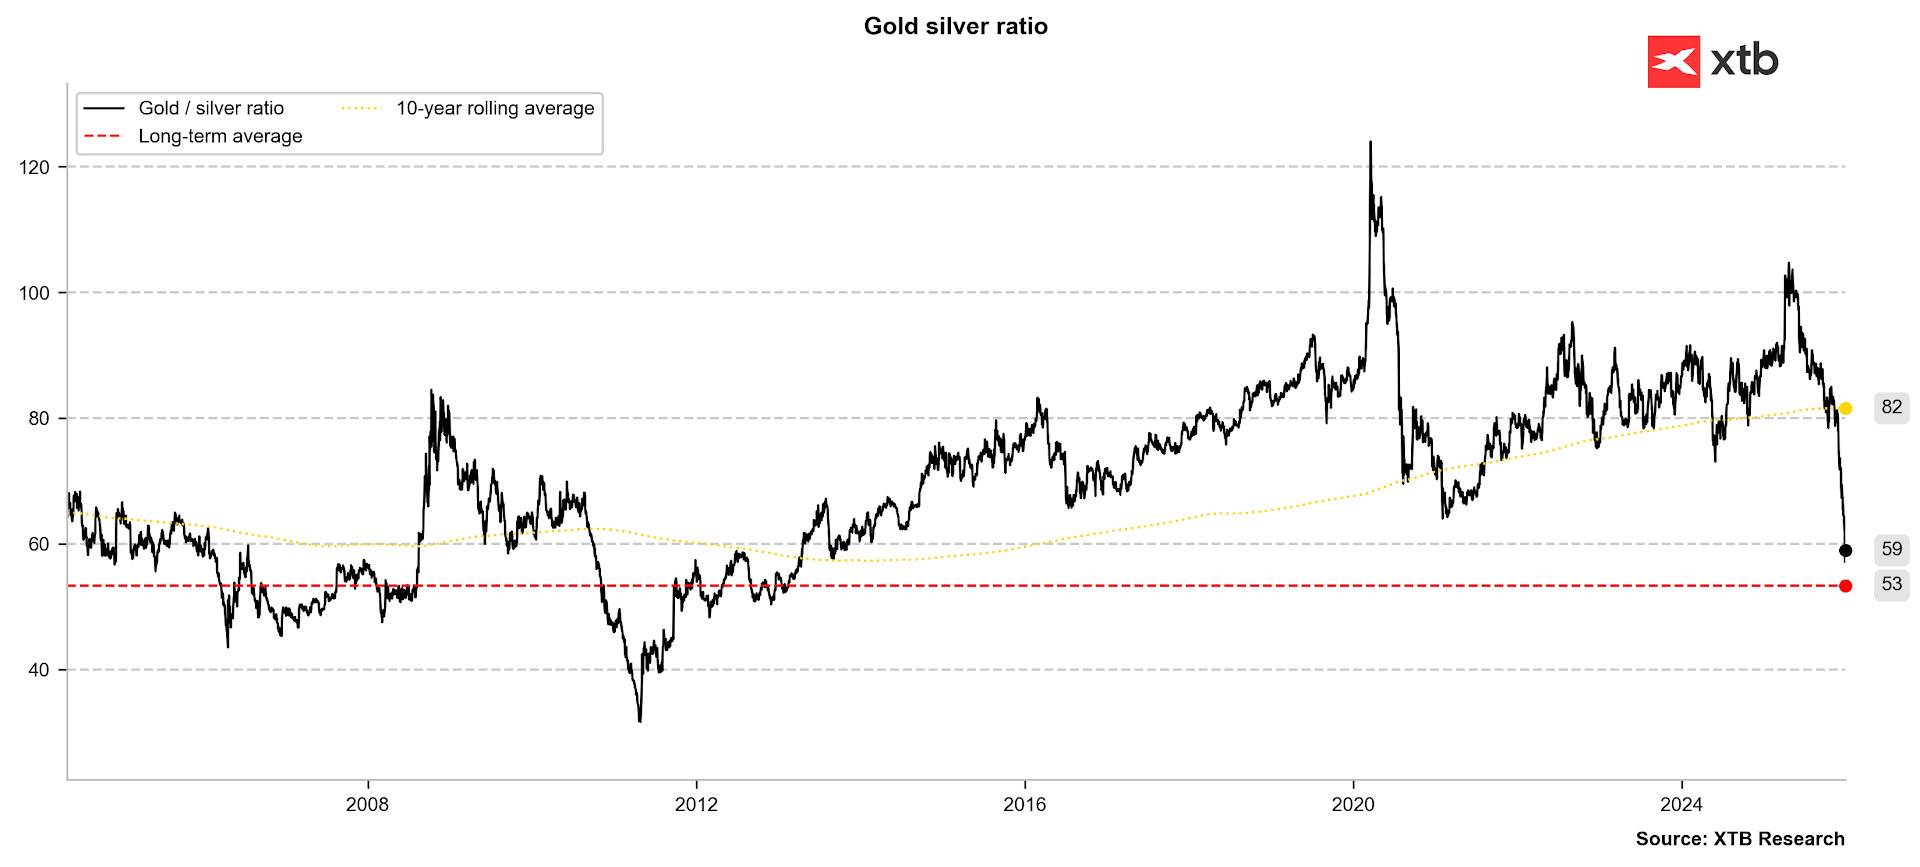 The gold-to-silver ratio approaches its long-term average of 53. Source: Bloomberg Finance LP
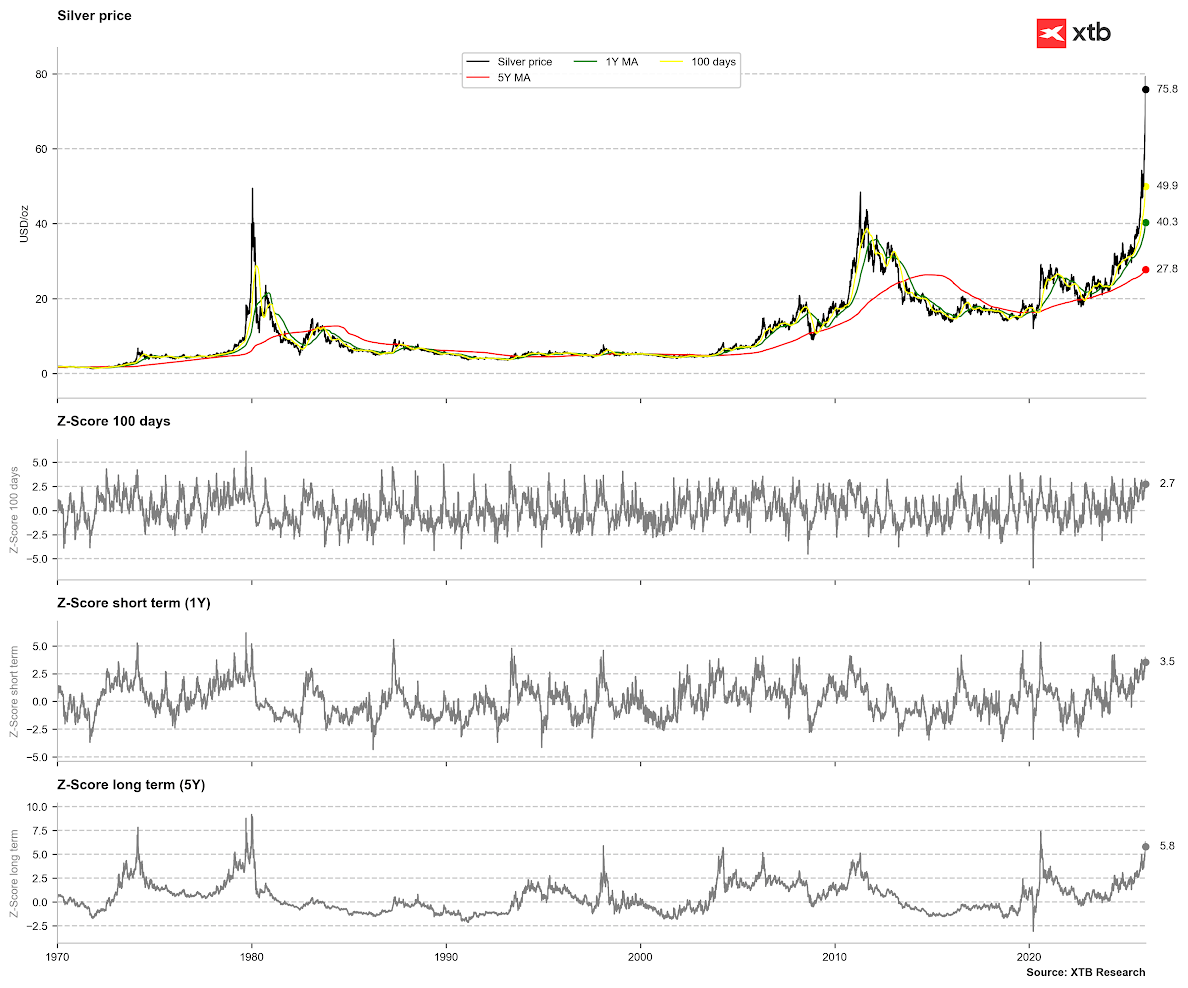
Moving averages suggest short-term exhaustion, though prices are not yet at extreme "overbought" levels relative to 1-year and 5-year averages. For the 1-year average, an extreme deviation would be 4–5 standard deviations; for the 5-year average, it would be approximately 7.5. However, from a long-term perspective, the price is already more stretched than it was in 2011. Source: Bloomberg Finance LP, XTB
A deeper correction remains a risk if we observe a decline in open interest following the margin hikes, an outflow from ETFs, or a broader downturn in market sentiment. History shows that corrections are typically prolonged, with the exception of 1980, when prices lost nearly 80% almost instantly. A historical average drawdown of roughly 60% would imply a target price of approximately $35 per ounce.
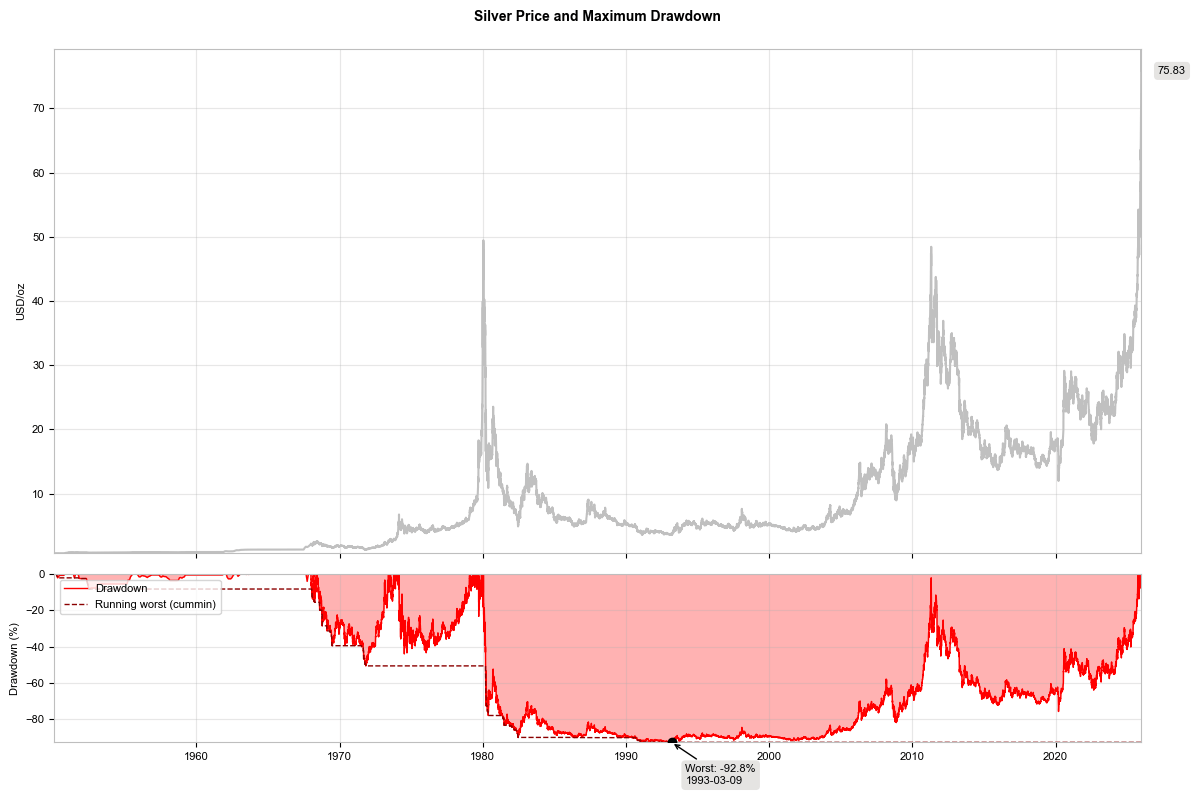
A 60% price retracement would imply a level of approximately $35 per ounce. Source: Bloomberg Finance LP, XTB
Technical Outlook
The metal is trading down nearly 4% today, though intraday volatility saw steeper declines. From today's peak, the retracement totals nearly 10%. The market is currently testing the 23.6% Fibonacci retracement of the latest bullish leg. To maintain the current upward momentum, the price should ideally hold above $60 per ounce, with critical short-term support established at $65.

Daily Summary: Equities rally on not-so-hawkish Fed and AI trade revival, Yen dominates FX, oil retreats (30.07.2026)
Unexpected FX intervention? USDJPY plummets more than 2%! 🇯🇵

Nasdaq futures rally more than 3% 🚀

US OPEN: Nasdaq rebounds! Microsoft and Lam Research earnings revive AI trade!