



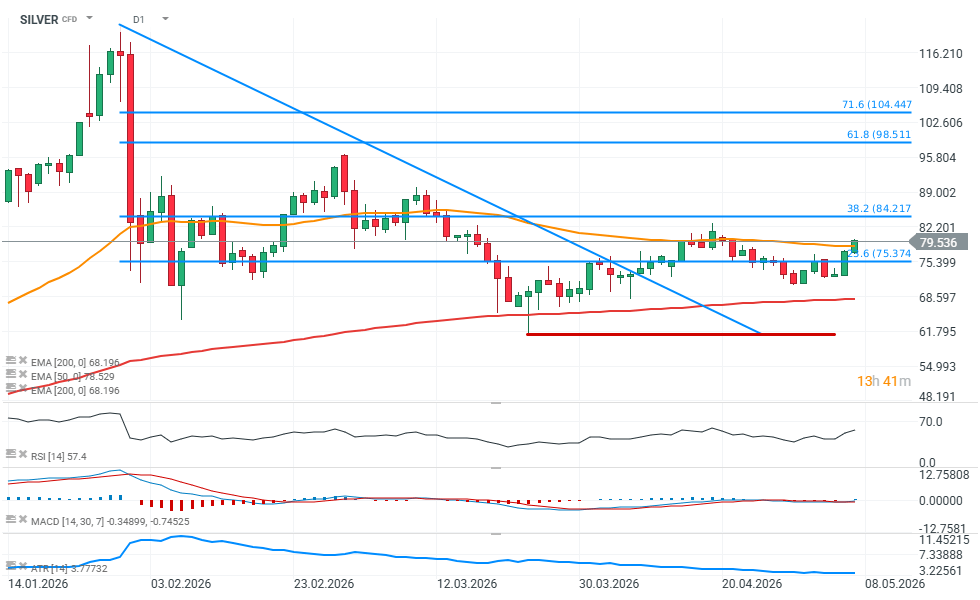
Source: xStation5
Looking at silver on the hourly timeframe, the chart shows a triangle formation, where the base scenario points toward an upside breakout. Such a move may already be unfolding, although the $80 area could still act as an important resistance zone, similarly to the $82–83 range, where the latest local peak is located.
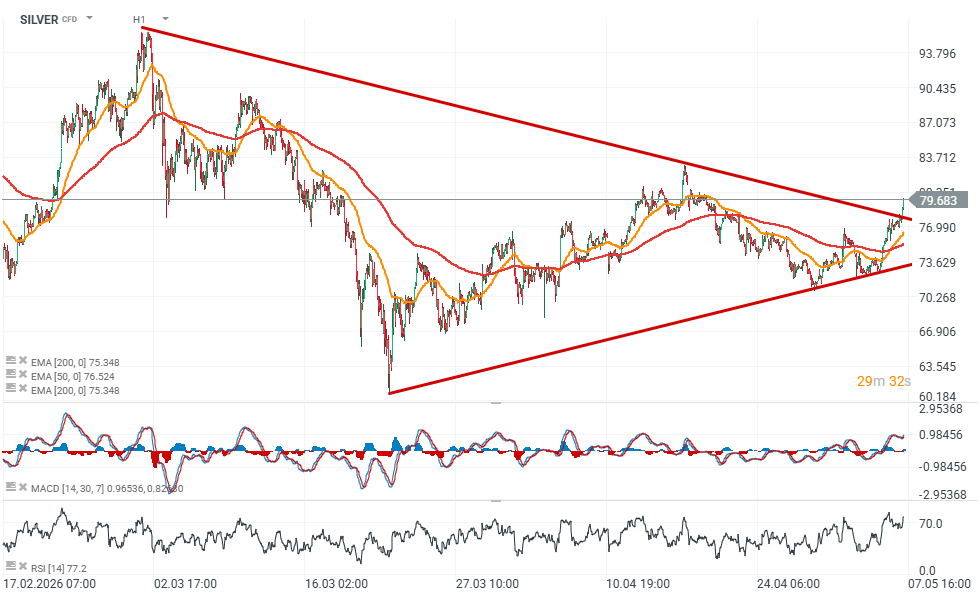
Source: xStation5



Daily Summary: Oil at five-month highs, indices under pressure (23.10.2026)


US Open: Further declines on Wall Street, Brent above 111 USD, AI correction continues (14.10.2026)


Chart of the Day: Is USDJPY running out of road? Inflation forces the BoJ to act, but the Fed could spoil the Yen’s rally



Macro Calendar: Preliminary PMI Readings and Earnings Ahead