
GBPUSD started Monday’s session with an upward move. Looking at the H4 chart from a technical point of view, one can see the pair has reached the key resistance . Should the sellers halt an upward move at the 1:1 structure marked with the red rectangle on the screen below, another downward swing may start. On the other hand, if bulls maintain the uptrend, resistance at 1.2985 may be at risk.
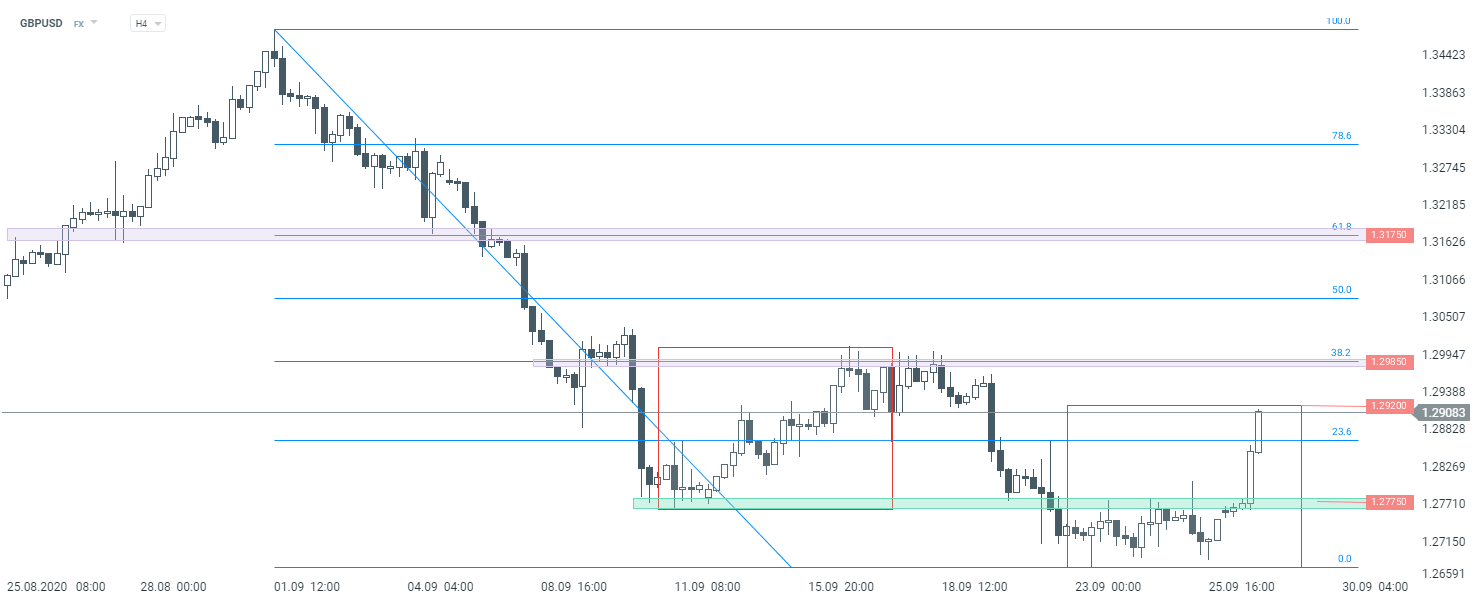 GBPUSD H4 interval. Source: xStation5
Market Wrap: Airlines Under Pressure, Europe Resists Expensive Oil

Chart of the Day: USDJPY – The Dollar Wins Another Round, but Tokyo Is Preparing a Response

BREAKING: German PPI slows down. Price pressures in the industrial sector are easing

Economic Calendar: Inflationary Pressure in Germany and Canada Alongside Poland's Economic Data Pack