
Yesterday's slump on the stock markets in Europe has contributed to the downward move in the US as well. Today, one can observe that markets attempt to erase recent losses. Looking at the Dow Jones Index (US30) chart from a technical point of view, the 27,100 pts handle is the key resistance in the near term. It results from the upper limit of local 1:1 structure. If the buyers do not manage to break above, the recent lows at 26,600 pts may be at risk. On the other hand, breaking above the aforementioned resistance will open the way towards the zone at 27,430 pts.
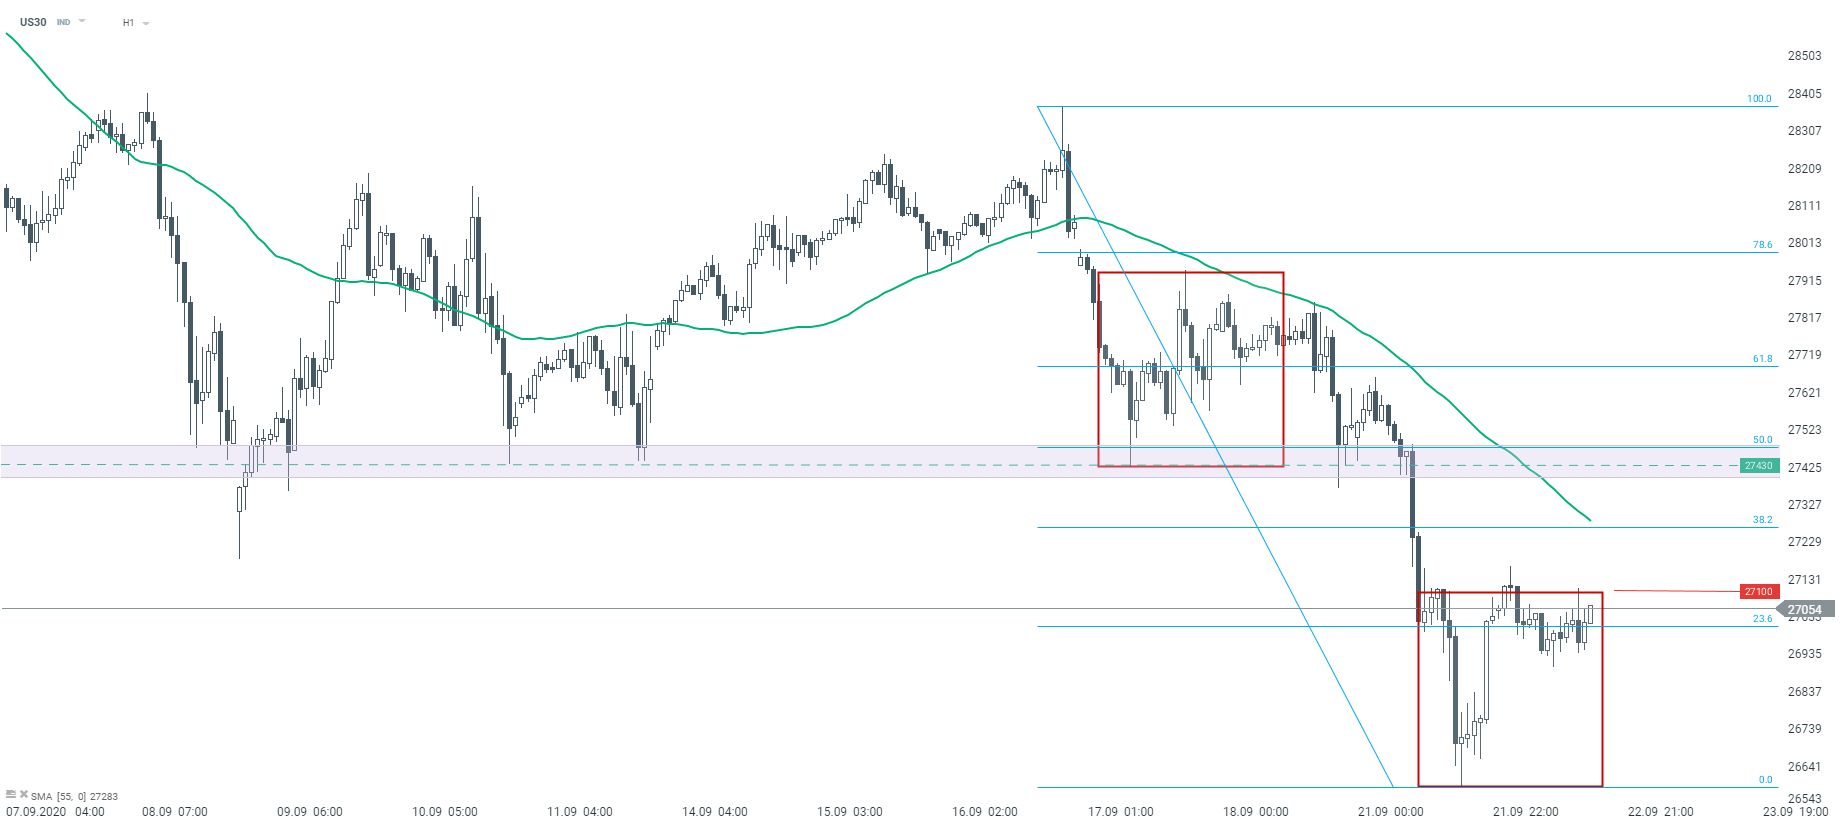 US30 H1 interval Source: xStation5

Daily Summary: Equities Diverge as Tech Lags, Europe Rallies on Earnings & PMIs (24.07.2026)

Three markets to watch next week (24.07.2026)

US OPEN: Nasdaq hits 1-month low! Geopolitics bring AI trade down!

Market Wrap: European Stocks Are Trying to Rebound as the Week Comes to an End💡