
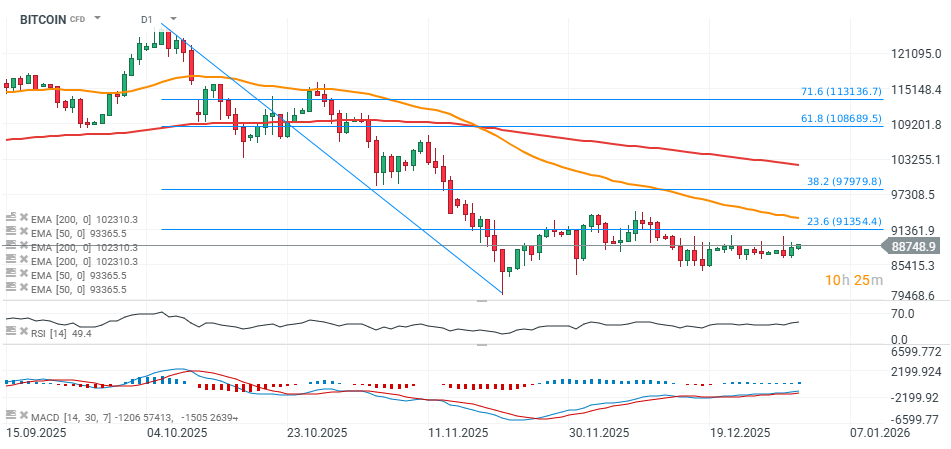
Bitcoin has disappointed the market this year, falling by nearly 5%, despite expectations of Fed rate cuts in 2026, more favorable regulation for the industry, and strong ETF activity that lasted roughly until the end of the calendar summer. BTC is currently trading almost 30% below its autumn peak (around $126,000). The price has already posted several bearish impulses, and after the most recent one on November 19, Bitcoin has been trying to hold key support levels.

Source: xStation5
Looking at the consolidation that followed the latest sell-off, we can identify a potential bull flag formation. It is worth noting that the last downward impulse was halted near $82,000, and since then the market has been attempting to rebuild strength heading into 2026. A decisive breakout above $94,000 could invalidate the pattern entirely. On the other hand, a drop toward $85,000 would likely confirm it and could signal another bearish leg lower.

Source: xStation5
From a Fibonacci retracement perspective (e.g., the 23.6% level), the $91,500 area stands out as a particularly important resistance zone, reinforced by prior price reactions. The EMA50 and EMA200 currently sit around $93,500 (near recent local highs) and $103,000, respectively. The $91,500–$93,500 range could therefore become a major stress test for bulls. Importantly, the descending channel that guided Bitcoin lower until early December has been broken, with price now moving into a consolidation zone marked by very low volatility.
Source: xStation5

Daily Summary: Lower inflation weakens the dollar and awakens gold and S&P 500 to gains
Fed Chair Kevin Warsh’s Q&A from Congress Testimony: Inflation stability is a key

Bypassing Hormuz: Gulf States Race Against Time

US Open: Nasdaq 100 gains 1% 🔼 Software stocks decline, JP Morgan rises after earnings