
Bitcoin is extending today’s sell-off and is sliding toward $66,500, which may represent a stronger support zone, matching the 2021 bull-market highs. The daily RSI has dropped to around 18, pointing to an extremely rare oversold condition. Additional fuel for a rebound could come from a 1:1 corrective move pattern.
If this scenario plays out and price consolidates in the $66,000–$70,000 area, a move back toward $75,000 over the next few weeks cannot be ruled out. That said, an additional downside impulse, similar in size to the current one, is also possible. Such a move could push Bitcoin toward $50,000, where we see important on-chain support levels, including the Delta Price. A potential reversal of the downtrend would become more likely after a breakout above $90,000 (the EMA50, marked by the orange line).
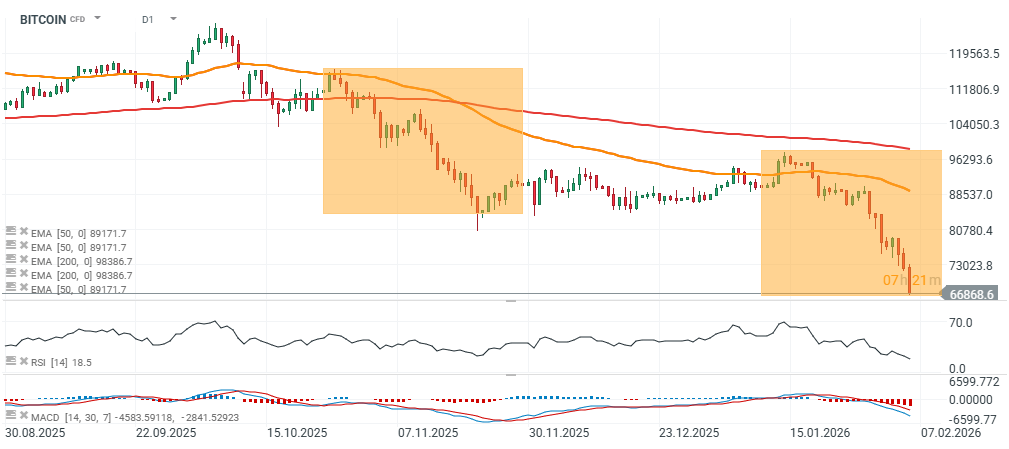
Source: xStation5
On a broader timeframe, we can see that an RSI near 18 occurred only in November 2023 and during the COVID crash in 2020.
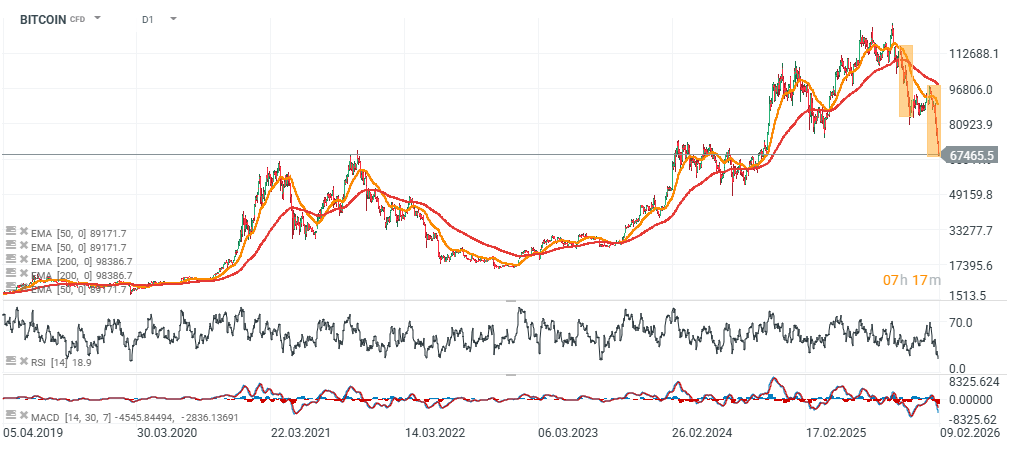
Source: xStation5

Daily Summary: Wall Street Regains Ground; Another Intervention in the Yen Market❓

Three Markets to Watch Next Week (July 31, 2026)

Market Wrap: European equities at 3-week highs! Apple dips in US premarket!

Euro Area core inflation above estiamtes! EURUSD under key resistance!