- What is the technical situation on USDIDX?
- What is the technical situation on USDIDX?
The dollar index (USDIDX) has been on a downward trend for quite some time. The local maximum was set on November 21, 2025, after which we observed a steady downward movement. The price fell to 97.50, which was tested twice in mid-December. However, there are currently no reliable signs of a trend reversal. In recent days, the price has rebounded from the 100-period moving average, marked on the chart with a blue line, and has also encountered resistance resulting from the 23.6% Fibonacci retracement level.
It seems, therefore, that until the price breaks through the 98.15 level, the downward trend will continue, and another test of the 97.50 level is possible. Otherwise, a break above 98.15 could lead to a correction towards 98.87, with the 38.2% Fibonacci level worth noting. For now, however, the main trend remains downward.
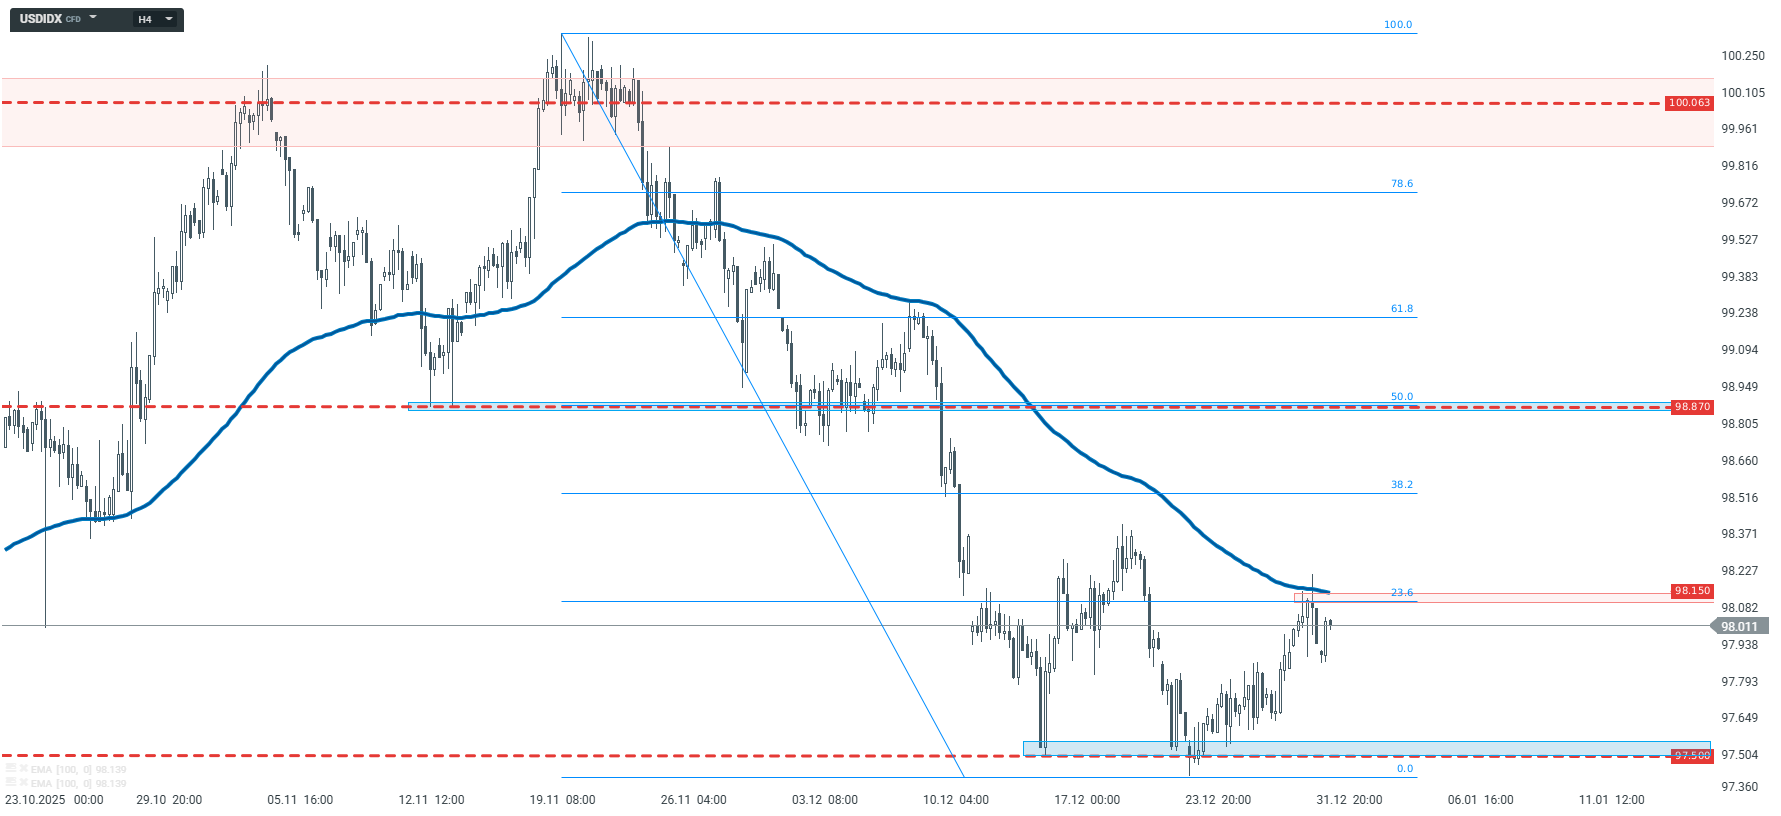
USDIDX – D1 interval | Source: xStation5

Daily Summary: Semiconductors Rise in the Shadow of Geopolitical Turmoil

Tech sector catches its breath 🚀

Red Sea, but not the indices : The effects of the Bab al-Mandab blockade.

US OPEN: Semiconductors drive a rebound