
Key takeaways
- Gold is falling from $4,190 to $4,130 per ounce.
- The RSI indicator stands at 82 points.
- The previous bullish impulse had a comparable 1:1 range.
Key takeaways
- Gold is falling from $4,190 to $4,130 per ounce.
- The RSI indicator stands at 82 points.
- The previous bullish impulse had a comparable 1:1 range.
Gold has declined from around $4,190 to $4,130, while the U.S. dollar is showing slight strengthening. The RSI indicator is hovering near 82 points, still signaling an overbought market.
- Looking back at the previous bullish impulse, followed by a consolidation phase around $3,300–$3,400, we can notice similarities to the latest upward move, during which gold surged rapidly from about $3,300 to nearly $4,200.
- If a 1:1 scenario were to unfold, a deeper pullback from current levels and a potential consolidation around $3,800 per ounce could be expected. At the same time, however, the spot market remains increasingly tight, and the fundamental outlook for further price appreciation remains strong.
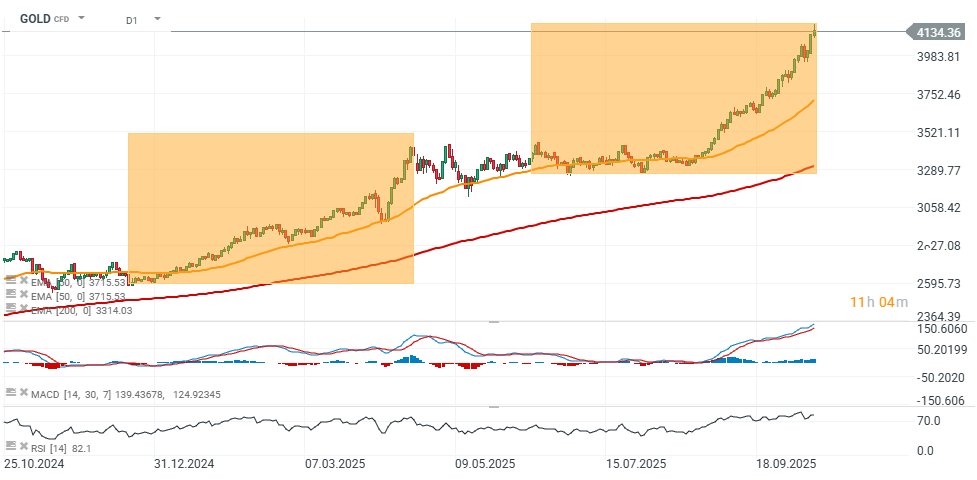
Source: xStation5

Daily Summary: Semiconductors Rise in the Shadow of Geopolitical Turmoil

Tech sector catches its breath 🚀

Red Sea, but not the indices : The effects of the Bab al-Mandab blockade.

US OPEN: Semiconductors drive a rebound