
Recent days bring a correction in the cryptocurrency market. Looking technically at the second most popular digital currency - Ethereum, a key technical level was broken. For some time on the D1 interval, the uptrend was "held" by a 1:1 structure. Each time the geometry was tested, it led to a resumption of the uptrend. However, no trend lasts forever, and in the event that today's D1 candle closes at the current level or lower - the declines may take a turn for the worse.
According to the Overbalance methodology, there will then be a negation of the arrangement of the largest correction, which opens the way for a change of trend, or at least a larger downward correction. If such a scenario is realized, the levels of $2310 and $2150, which are derived from the 50- and 100-period moving averages (EMA-exponential average), respectively, should be considered as targets for sellers.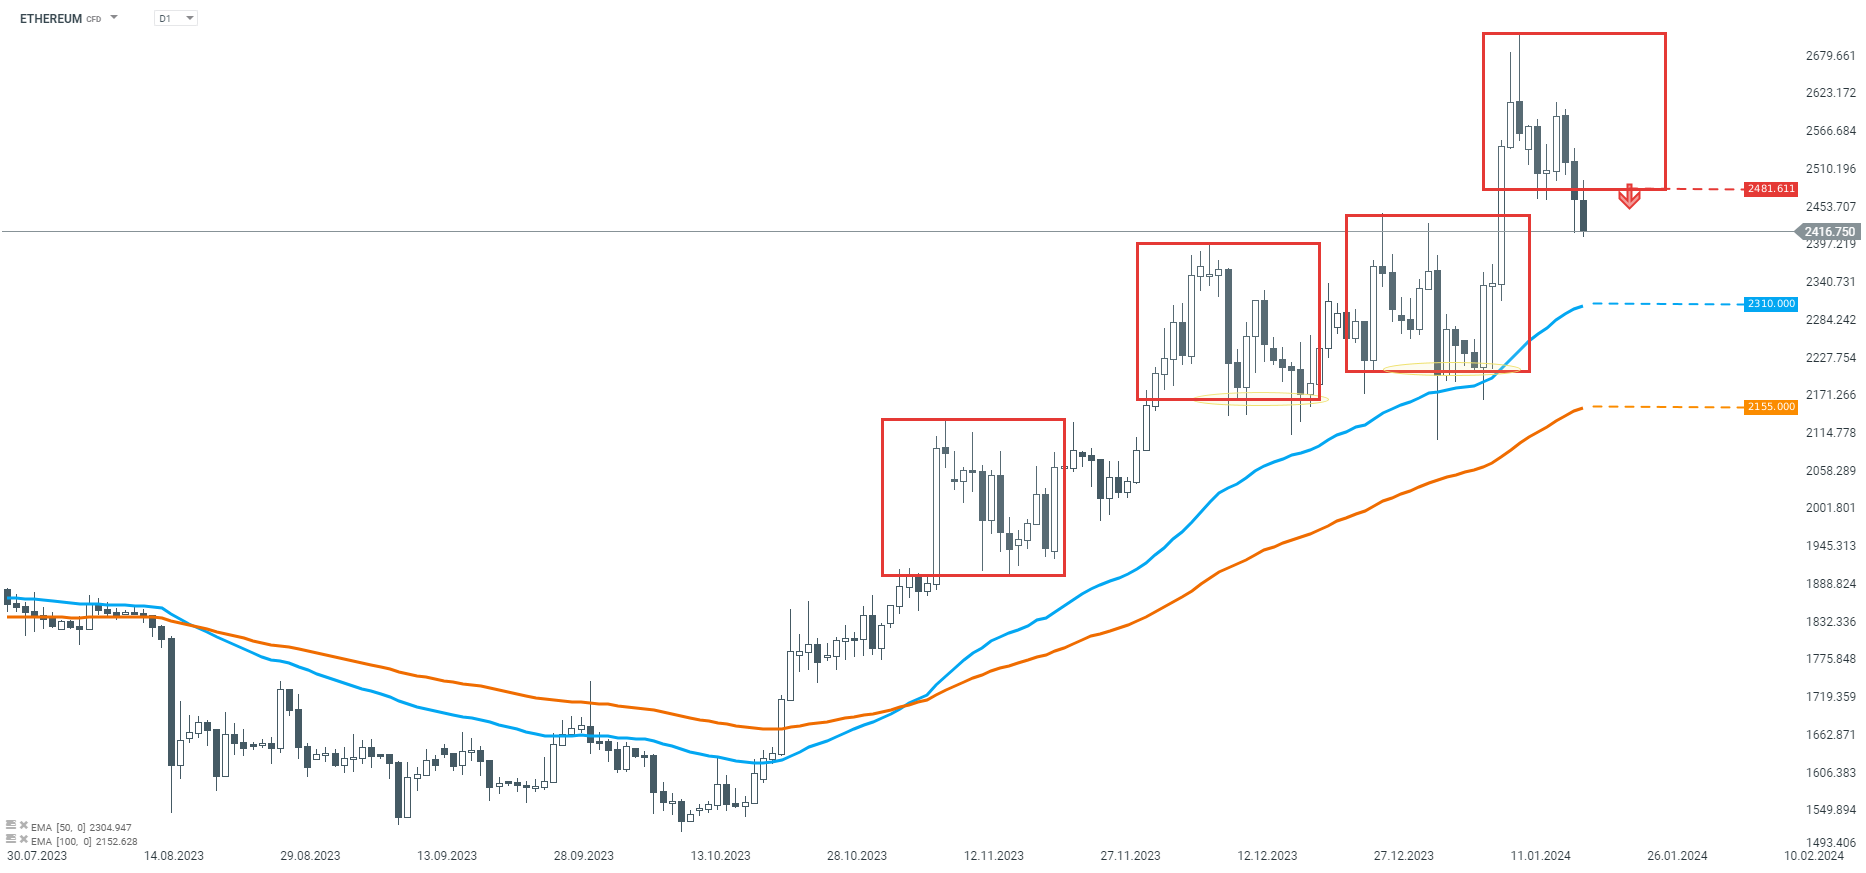
Ethereum D1 interval. Source: xStation5
Descending to a lower time interval, we see that after breaking out of the 1:1 geometrical pattern, the declines stopped at the height of the support zone at $2440, stemming from the previous tops. However, the price returned to the 1:1 geometry, then moved down again. If the breakout of $2440 proves to be sustained, the declines could gain momentum towards the levels of $2310 and $2155 determined from the D1 interval.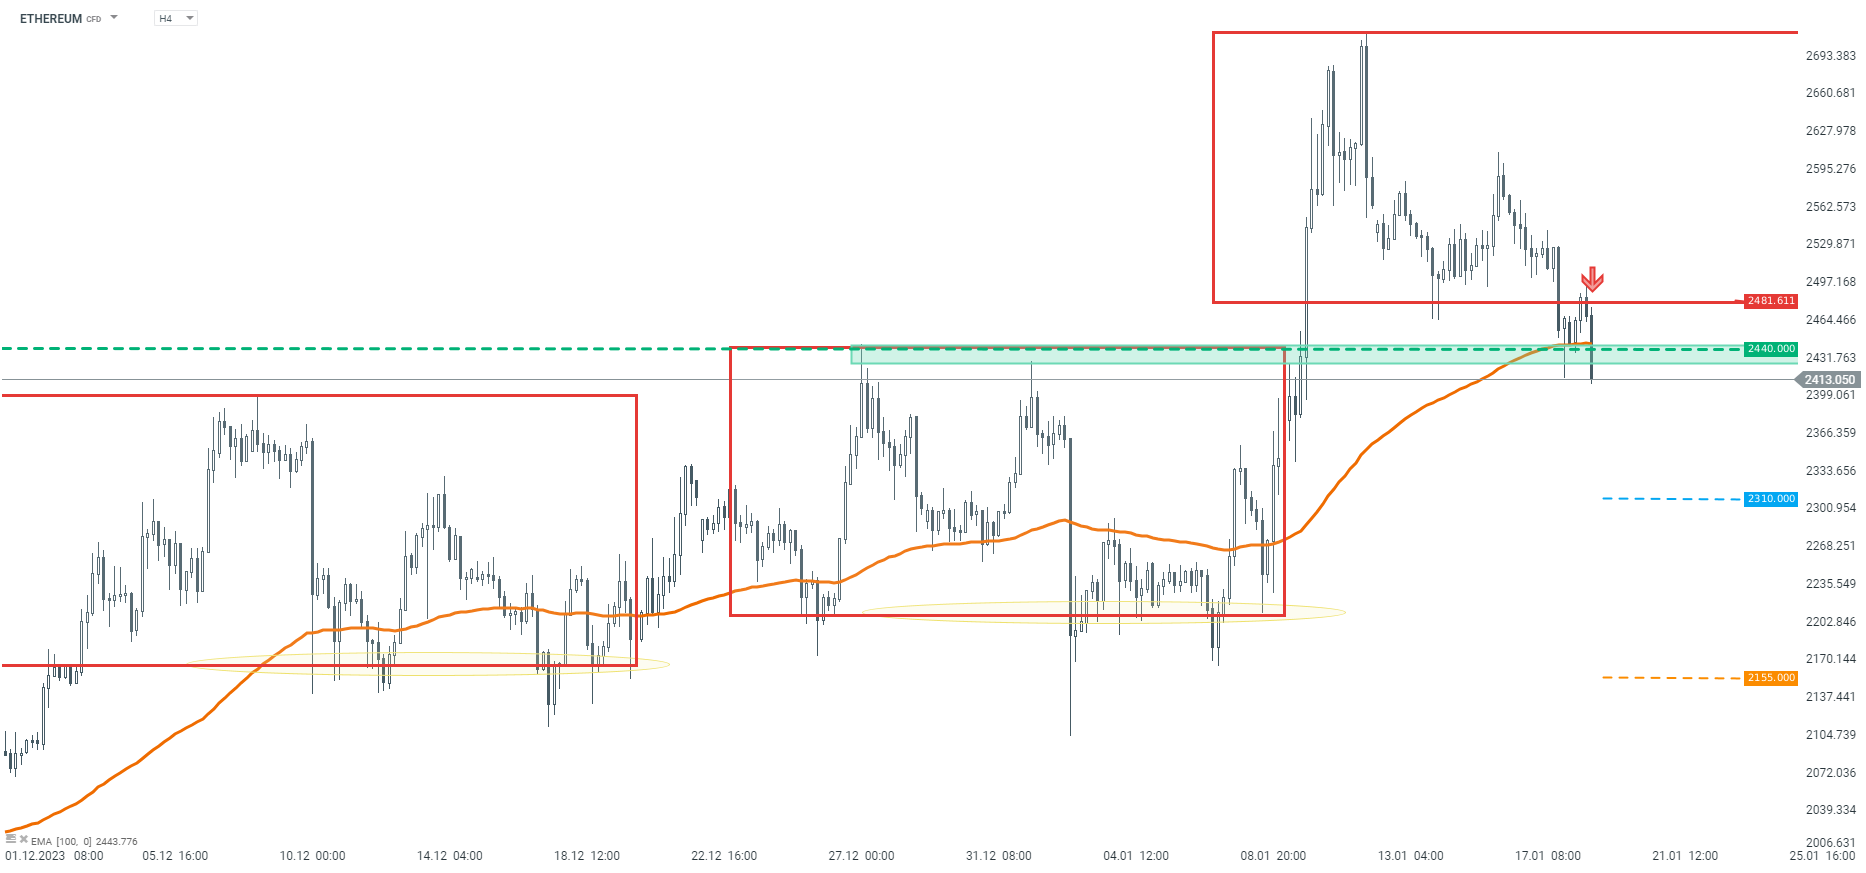
Ethereum H4 interval. Source: xStation5

Daily Summary: Trump's War Threats Weigh on Markets. Wall Street Sinks into the Red

Bitcoin Climbs Above $66,000 as ETF Flows Recover but Glassnode Warns of Higher Volatility

Morning Wrap: Oil Climbs Back Above $90 as Chinese AI Weighs on Tech Stocks.

Morninga Wrap: Wall Street Under Pressure. AI Loses Momentum, Netflix Disappoints, and the Persian Gulf Erupts