Traders are waiting for the FOMC decision scheduled for the evening (6:00 pm GMT). Volatility is expected to be elevated as not only the decision will be announced but also the latest set of quarterly macroeconomic forecasts will be released. GOLD, DE30 and US100 are among markets that may experience big moves in the aftermath of Fed's meeting.
GOLD
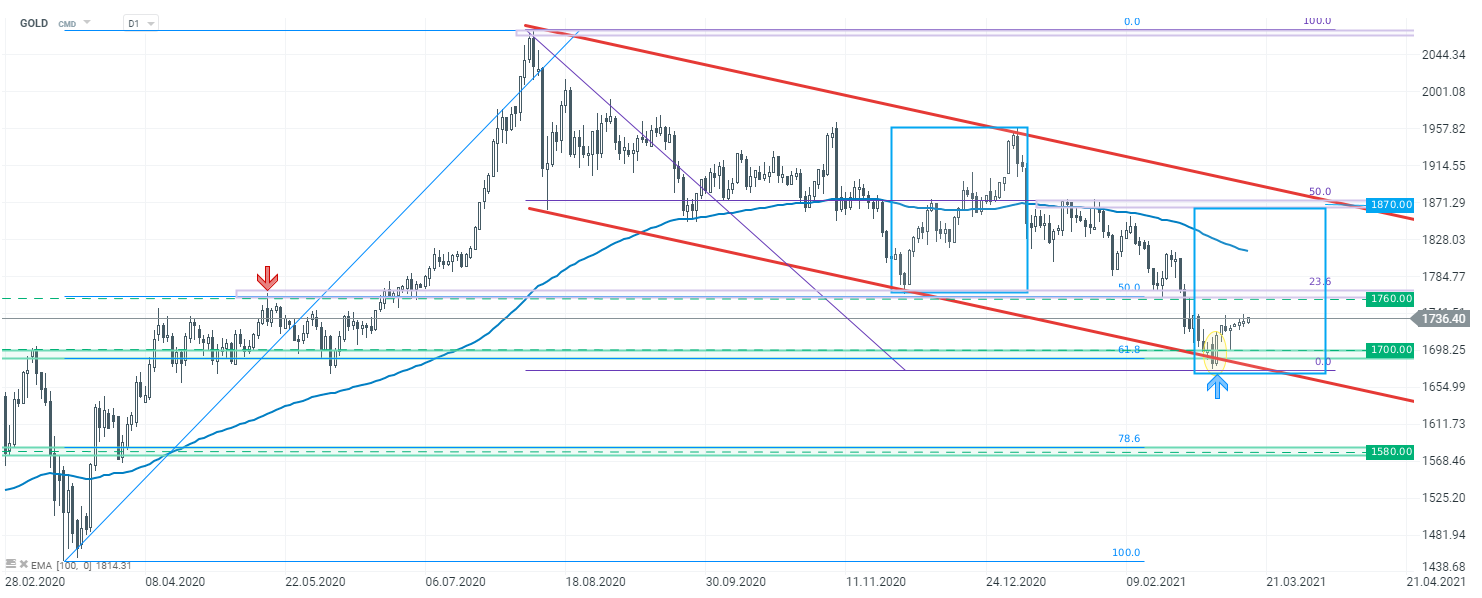
Let’s start today’s analysis with the gold market. Looking at the daily interval, one can see that an upward correction was launched after price bounced off the $1,700 support. Should the current sentiment prevail, an attack on the $1,760 resistance may be on the cards. In case price breaks above this handle, the upward move may expand towards resistance marked with the upper limit of 1:1 structure ($1,879) and 50% Fibonacci retracement of the downard move started in August 2020. On the other hand, if sellers manage to break below the aforementioned $1,700 support, the way towards the next demand zone at $1,580 will be left open.
 GOLD D1 interval. Source: xStation5
DE30
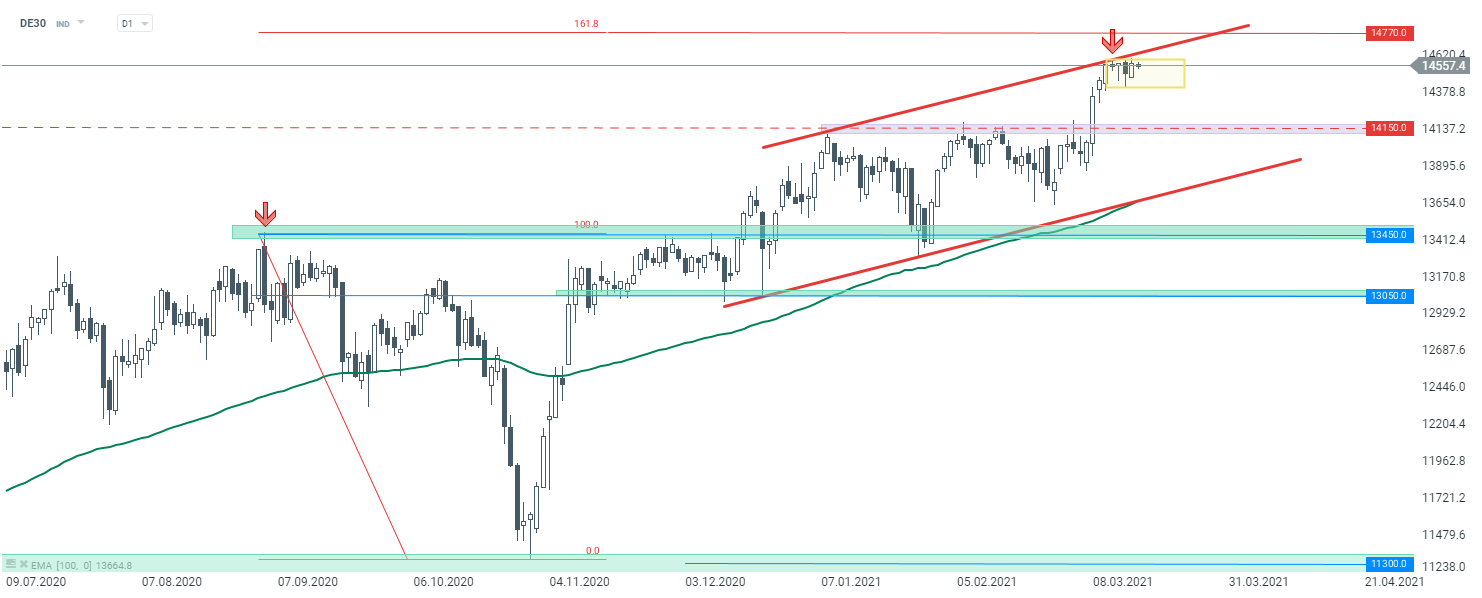
German Dax (DE30) has been trending in an upward move recently. However, upward momentum slowed down after the index reached the upper limit of the local upward channel at the end of the previous week. Looking at the chart at a daily time frame, we can see that the price trades sideways in a local trading range marked with a yellow rectangle. Until the range is broken, continuation of a sideways move is the base case scenario. However, today’s FOMC meeting may provide an opportunity to break out from the range. In case a break higher occurs, a resistance at 14,770 pts, marked with the 161.8% Fibonacci exterior retracement, could be the potential target for market bulls. On the other hand, breaking below the range could see price decline towards a support at 14,150 pts.
 D30 D1 interval. Source: xStation5
US100
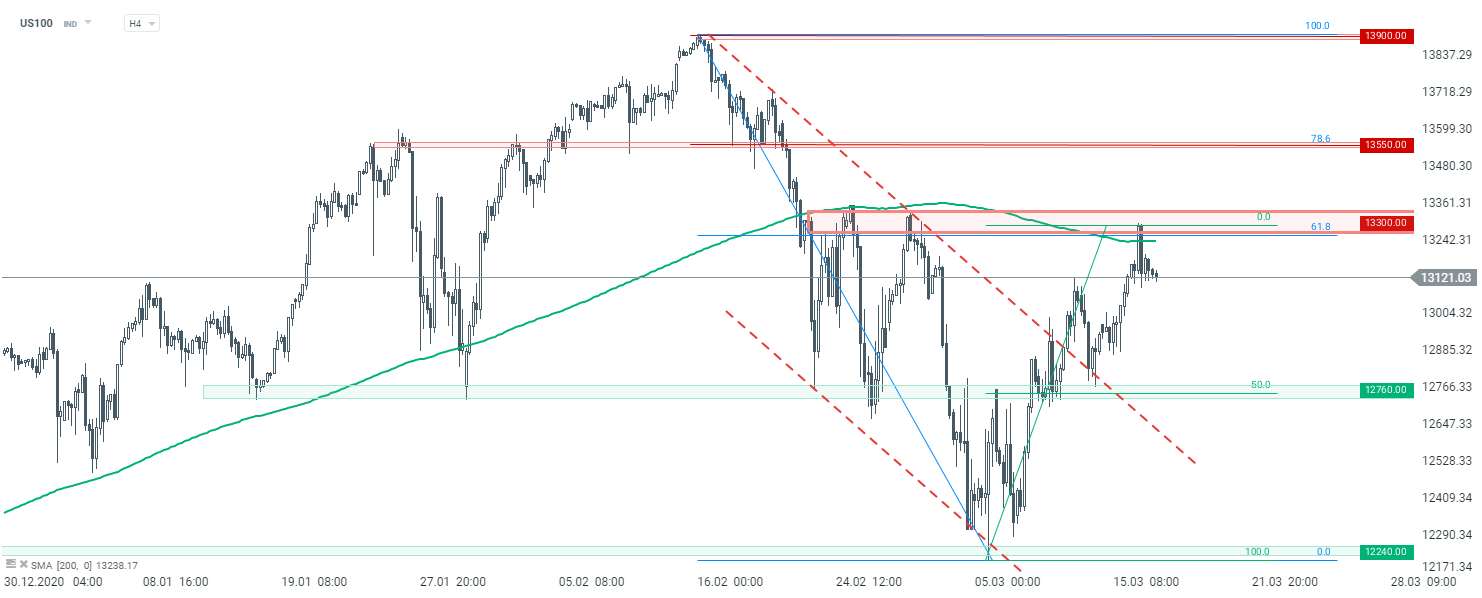
Last but not least, let’s take a look at the US tech index - Nasdaq (US100). Looking at the H4 interval, one can see that recent downward correction might have finished already. Market bulls managed to halt declines at the 12,240 pts support and the price broke above the downward channel, signaling possibilly resumption of the uptrend. However, the subsequent upward move was stopped at the key short - term resistance at 13,300 pts, marked with previous price reactions and the 61.8% Fibonacci retracement of the recent downward move.Should buyers manage to break above it, an upward move may accelerate. On the other hand, if the price stays below 13,300 pts, downward correction may be resumed and deepened.
 US100 H4 interval. Source: xStation5

Daily summary: Silver plunges 9% 🚨Indices, crypto and precious metals under pressure

US100 loses 1.5% 📉

🚨Gold slumps 3% amid markets preparing for Chinese Lunar Year pause

Cocoa falls 2.5% to the lowest level since October 2023 📉


