
DE30
Let’s start today’s analysis with the German index - DAX (DE30). Looking at the daily interval, one can see that the price broke above the local trading range, which is marked with the blue box on the chart below. Despite a break out of the consolidation range, the upward momentum slowed down and the buyers did not manage to break into fresh all time highs near the 15,800 pts. However, the long-term sentiment remains upward, and the continuation of upward move looks possible. In such a scenario, the exterior 127.2% Fibonacci retracement is the next target for market bulls.On the other hand, if the index starts a downward correction, the nearest support to watch can be found at 15,430 pts, where the lower limit of aforementioned consolidation range is located.
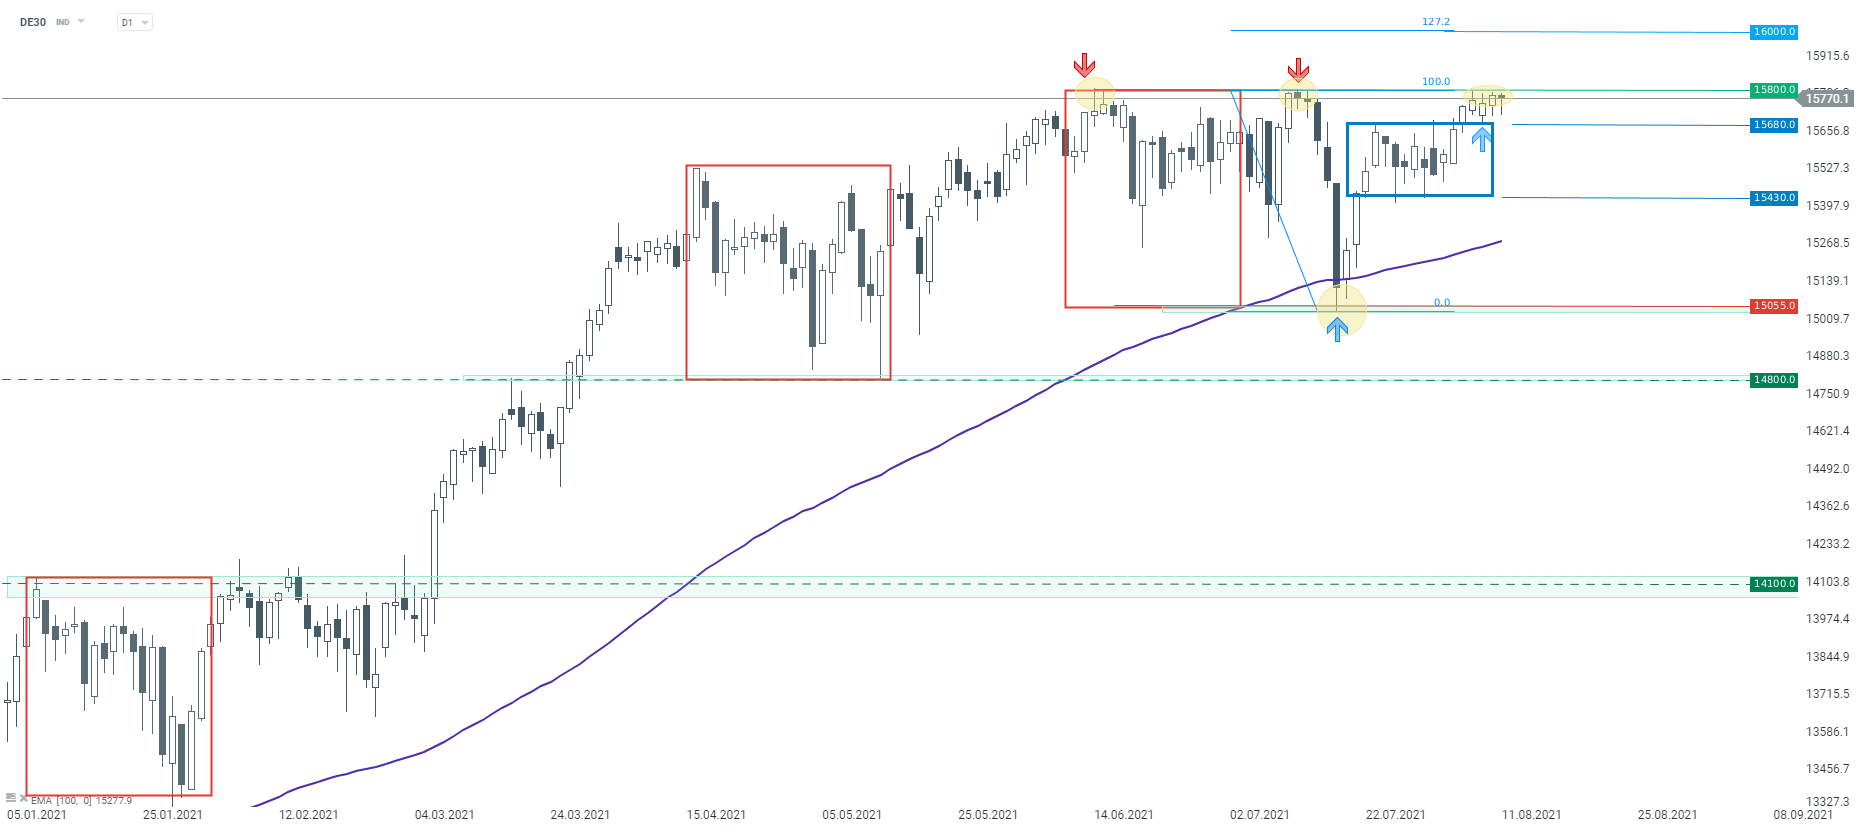 DE30 D1 interval. Source: xStation5
OIL.WTI
Next, let's take a look at the oil market. Analysing the chart on the D1 interval, one can see that the recent downward correction stopped at the key support area. The zone marked with green colour on the chart below is a result of lower limit of 1:1 structure, 38.2% Fibonacci retracement as well as lower limit of upward channel. This area was tested in July for the first time and on Monday for a second time/ Market bulls seem to be in advantage for now. According to the classic technical analysis, bouncing off this support confirms mid-term bullish sentiment and the continuation of an upward trend seems to be the base case scenario. The nearest resistance to watch lies at $73.,80. One should also pay attention to the local sloping trend line.
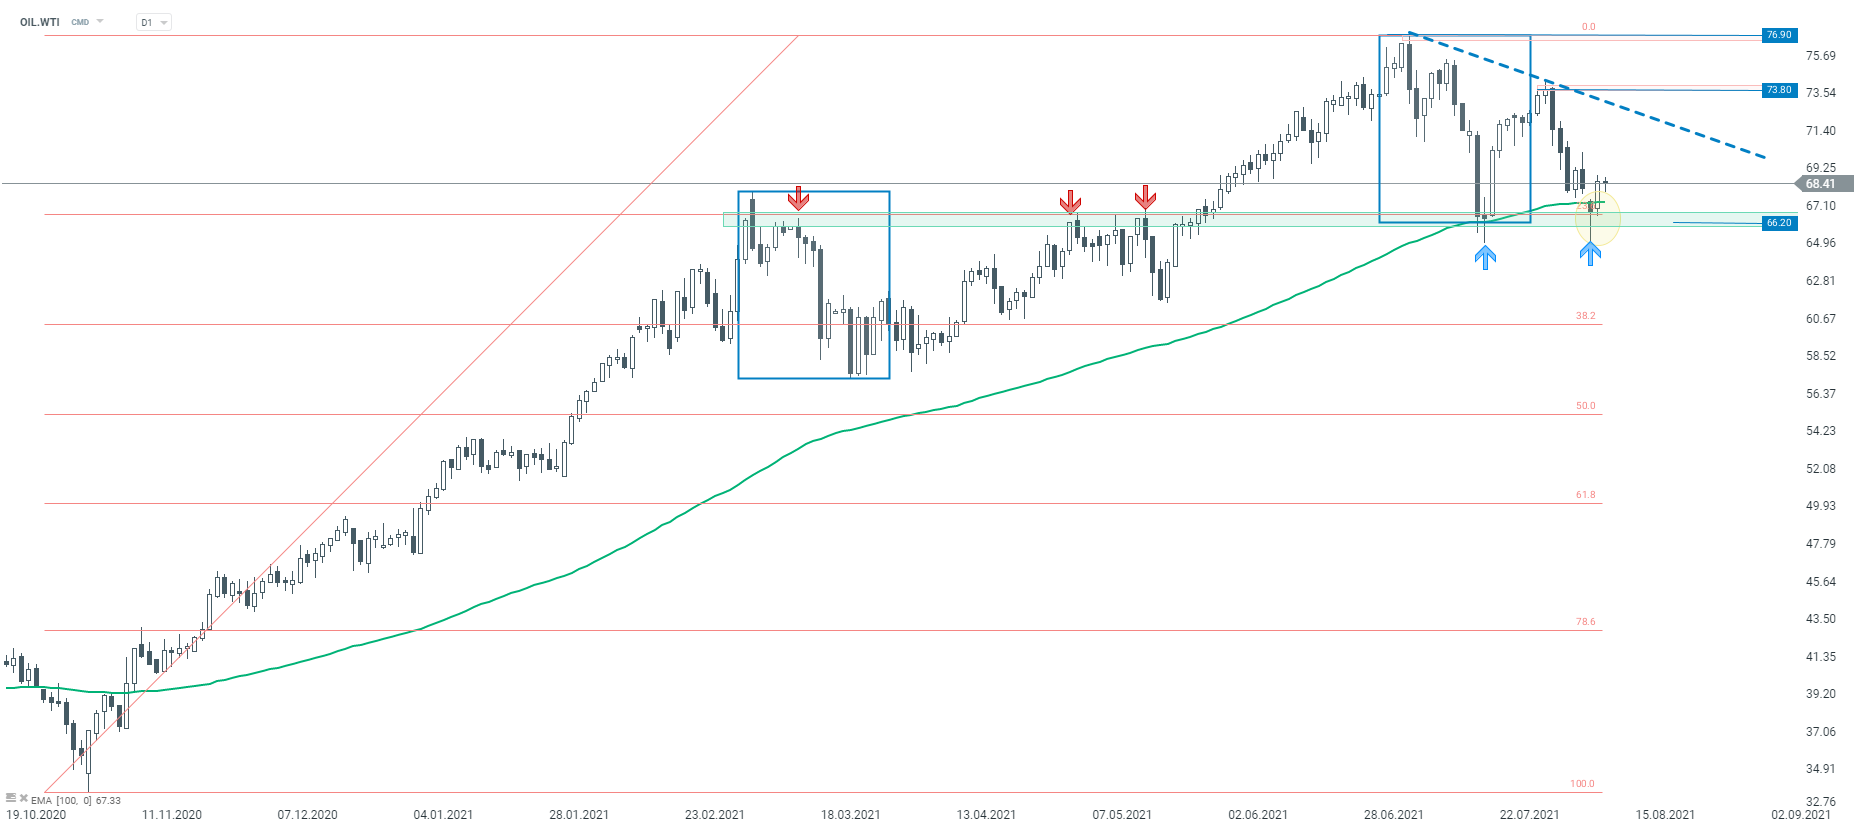 OIL.WTI D1 interval. Source: xStation5
EURUSD
Last but not least, let's look at the EURUSD chart. The main currency pair has been trading in a downward trend recently. However, in a long-term view, that is since March 2020, one can still talk about an upward trend and the recent downward move may be the ABC correction. Should we assume such a scenario, the pair cannot breach the support at 1.1600 which is a result of the lows from September and November 2020. This support is marked also with the 61.8% Fibonacci retracement of the recent upward move, as well as 1:1 geometry. Nevertheless, in case of a drop below, the downward movement may accelerate.
 EURUSD D1 interval. Source: xStation5

Daily Summary: A sell-off with a spin-off

Three Markets Worth Watching Next Week (17.07.2026)

Iran Escalation: What to Watch and What to Expect

US OPEN: The market extends losses as investor concerns grow