
S&P 500 (US500), as well as other US indices, are dropping today. Major Wall Street indices are trading over 1% lower at press time, with Nasdaq-100 (US100) taking a 1.7% hit and small-cap Russell 2000 (US2000) dropping 1.5%. S&P 500 trades 1.3% lower while Dow Jones (US30) 'outperforms' with a 1.1% drop.
Reasons behind sell-off on the stock market remain the same - continued pick-up in yields triggered by expectations that Fed may have to tighten policy more. One reason behind such a view are elevated oil prices that may fuel re-acceleration in inflation and force Fed to make another move on rates. Today's JOLTS data signaled that awaited US labor market cooling may not be coming anytime soon and added to concerns. 10-year US Treasury yields are up 9 basis points today and are closing in on 4.77% - the level not seen since mid-2007.
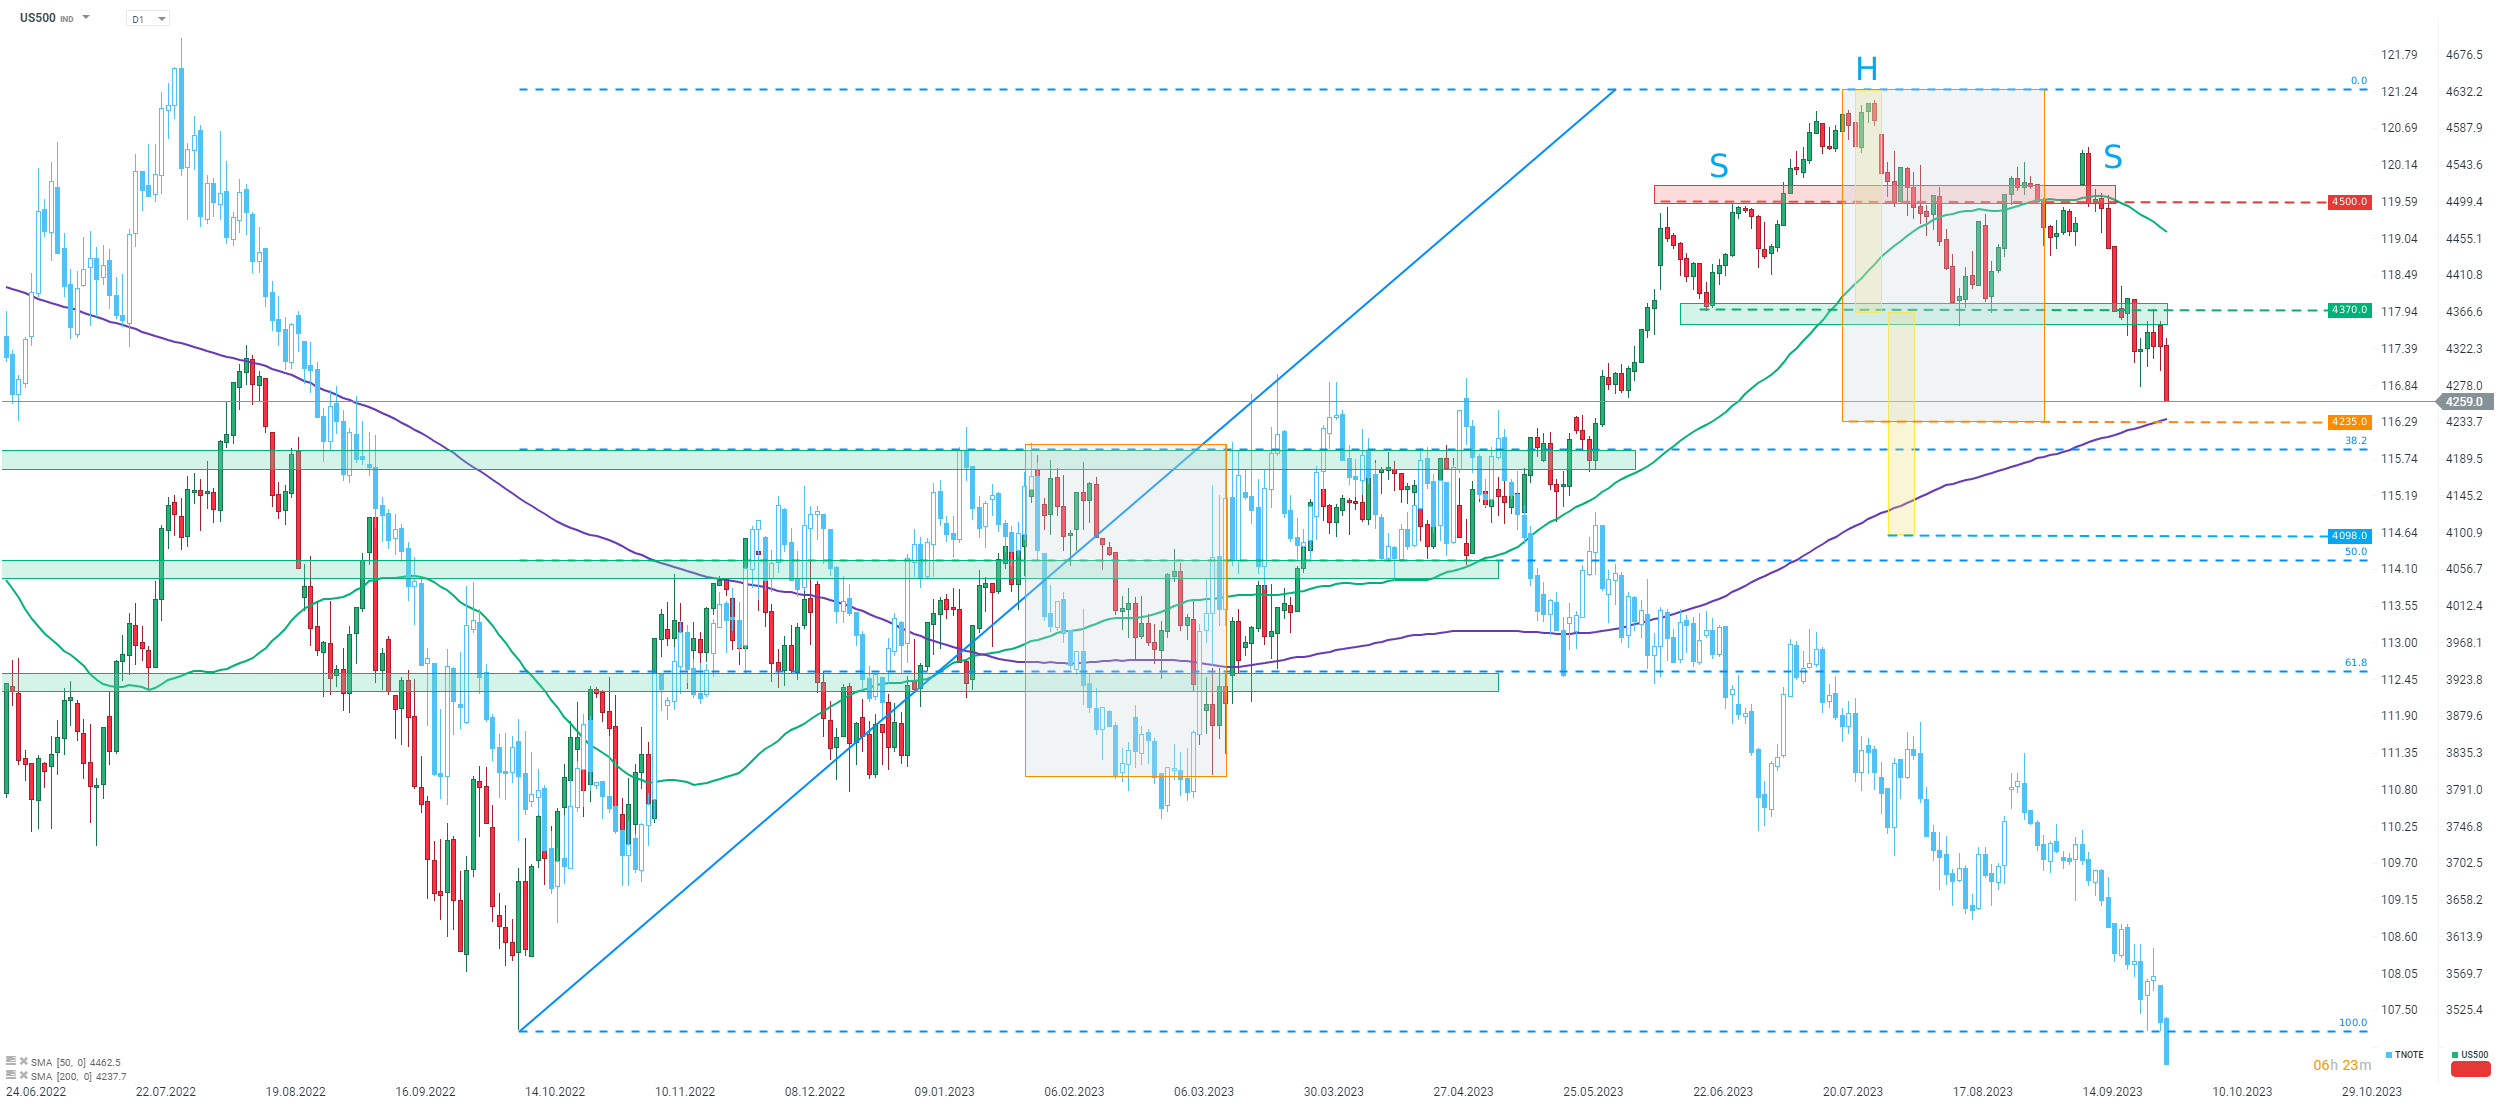
Taking a look at the US500 chart at D1 interval, we can see that the index is taking a big dive today and overtook an intraday low from September 27, 2023. As a result, the index reached the lowest levels in 4 months! A key near-term level to watch can be found at 4,235 pts, where the lower limit of the Overbalance structure and 200-session moving average (purple line) can be found. According to Overbalance methodology, a break below this level would signal a bearish trend reversal. Another point to note is that the index has recently broken below the 4,370 pts zone, which served as the neckline of the head and shoulders pattern. Textbook range of this pattern suggests a possibility of a drop to as low as 4,098 pts.
 Source: xStation5

Daily Summary: 📉 A Red Day Across Markets. AI Sector Weighs on Wall Street, Precious Metals Under Pressure
US Open: Blood on Wall Street as Semiconductor Sector Extends Correction

Chart of the day: Nasdaq futures dip 0.6% despite TSMC earnings beat! AI sanity check? (16.07.2026)

Economic Calendar: Earnings, US Retail Sales and Fed to Fight for Investors' Attention (16.07.2026)