
America’s earnings machine is still running at high RPM. As the Q4 2025 reporting season heads into the final stretch, the picture is consistent: companies aren’t just delivering—they’re doing it broadly, across both profits and revenues. The real question is how these results stack up against historical trends. That matters, because at this point in the cycle the market doesn’t reward “accounting wins.” It rewards real revenue streams, durable margins, and the ability to sustain momentum against a tougher year-ago base. Here’s what the FactSet data show (as of February 13).
Results snapshot
- With 74% of S&P 500 constituents having reported, 74% posted a positive EPS surprise and 73% beat on revenues. Earnings are growing at a pace that, on paper, looks like a luxury: blended earnings growth for Q4 2025 stands at 13.2% year over year. If that print holds, the index will log a fifth consecutive quarter of double-digit earnings growth. In plain terms: the earnings cycle remains in expansion mode, not in its late-stage fade.
- Revenues are sending an especially important signal. Blended revenue growth for Q4 is 9.0% year over year—the strongest since Q3 2022. More importantly, this number has been steadily revised higher: from 6.5% at the end of September, to 7.8% at the end of December, and now to 9.0%. The bar has been moved up, and that’s usually a better problem than watching estimates slide lower week after week.
- So who drove those revisions? Since December 31, four sectors have contributed the most to the improvement in revenue growth: Information Technology, Health Care, Communication Services, and Industrials. In Tech, meaningful upside revenue surprises from Apple ($143.76B vs. $138.39B), Super Micro Computer ($12.68B vs. $10.42B), and Microsoft ($81.27B vs. $80.31B) helped lift the sector’s revenue growth to 20.6% from 17.9%.
- In Health Care, Cigna, CVS, Eli Lilly, and Centene added noticeably, pushing sector growth to 10.3% from 9.0%. In Communication Services, Alphabet and Meta helped accelerate growth to 12.2% from 10.2%. In Industrials, Boeing, RTX, and Caterpillar raised blended growth to 7.8% from 5.8%. Positive surprises from Apollo, Phillips 66, Amazon, and Ford also had a visible impact on lifting the index-level revenue growth rate.
- Guidance for Q1 2026 is starting to sound more “CFO” than “sales-floor”: 31 companies have issued negative EPS guidance versus 38 with positive guidance. The balance is still positive, but not enough to ignore the more cautious tone—especially with valuations high and the market increasingly sensitive to any cracks in the narrative.
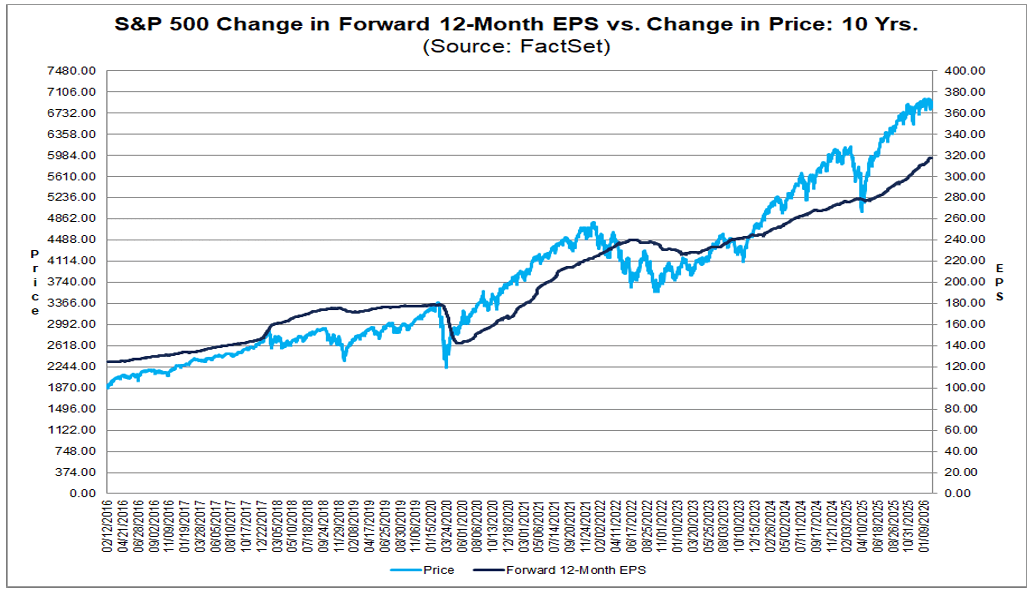
- Valuation is the lens through which the entire season has to be read. The S&P 500’s forward 12-month P/E is 21.5, above the 5-year average (20.0) and the 10-year average (18.8). Investors are already paying a premium for quality and predictability. In that environment, “good” often isn’t good enough—you need “better than good,” and you need it consistently.
There’s one more piece of the puzzle: the market expects revenue growth to cool starting in Q1 2026 (8.7%, then 7.9%, 7.3%, and 7.4% across the remaining quarters of 2026). Those aren’t bad numbers, but they are normalization. And normalization at 21.5x forward earnings means one thing: the margin for error is smaller. For now, the setup remains constructive—broad beats, solid profit growth, and accelerating revenues. The question for the coming weeks isn’t whether the season was good. It’s whether momentum is strong enough to carry a valuation premium as growth rates step down from today’s levels.
Source: Fact Set
Disappointing figures?
The back half of the Q4 2025 season hasn’t delivered a dramatic twist, but it has sharpened the picture. This is no longer just a story about the pace of growth—it’s about the quality of surprises, sector composition, and how the market digests the numbers against a demanding valuation backdrop.
- 74% of the index has reported. Of those companies, 74% beat the EPS consensus, 6% came in in line, and 20% missed. The beat rate is below the 5-year average (78%) and the 10-year average (76%), suggesting the bar was set relatively realistically. At the same time, the magnitude of upside surprises—7.2% above estimates—remains close to historical norms (5-year: 7.7%; 10-year: 7.0%). Fewer fireworks in the number of beats, but solid quality in aggregate.
- Over the past week, positive and negative EPS surprises across multiple sectors largely offset each other, leaving blended earnings growth unchanged at 13.2% versus the prior week. That said, it’s a clear jump from the 8.3% pace recorded at the end of December. Put differently: the upward revisions since the start of the year were real, even if the most recent days have been about consolidation rather than acceleration.
- Since December 31, the biggest contributors to the improvement in earnings growth have been Industrials, Information Technology, Communication Services, and Financials. Nine of eleven sectors are now reporting year-over-year earnings growth; declines are concentrated in Consumer Discretionary and Energy, reinforcing that this is not a uniform cycle and cost pressures still matter in parts of the economy.
- On revenues, 73% of companies have beaten estimates—above the 5-year average (70%) and the 10-year average (66%). The aggregate revenue surprise is 1.6% above estimates, below the 5-year average (2.0%) but above the 10-year average (1.4%). Blended revenue growth for Q4 has risen to 9.0% from 8.8% a week earlier and 7.8% at the end of December. That marks the fastest pace since Q3 2022 and extends the streak to a 21st consecutive quarter of revenue growth for the index. Ten sectors are reporting year-over-year revenue growth; Energy is the lone decliner.
- Structurally, a few things stand out. Communication Services (94%) and Information Technology (92%) have the highest percentages of companies beating EPS estimates. On the other end, Real Estate has the lowest beat rate (48% of companies exceeding expectations on FFO). In aggregate, Industrials show the largest positive gap between actual and estimated earnings (+30.5%), though part of that strength is driven by one-off items—most notably a significant transaction-related gain at Boeing and a tax benefit at GE Vernova. In Tech (+8.3%) and Communication Services (+7.0%), the upside versus consensus looks more operational, with a broader set of companies printing meaningfully ahead of expectations.
- Looking ahead, consensus calls for earnings growth of 11.1% in Q1 2026 and 14.9% in Q2 2026, with full-year 2026 growth projected at 14.4%. That’s an ambitious path that assumes sustained momentum in both margins and revenues. The forward P/E at 21.5 is below the 22.0 level seen at the end of December, but it remains above longer-term averages—this market is pricing continuation, not a stumble.
Next week, another 57 S&P 500 companies are scheduled to report. The season hasn’t changed the core narrative of a healthy earnings cycle, but it has underscored what matters most at elevated valuations: not just whether companies beat consensus, but how repeatable the sources of those beats are. One-off accounting or transaction benefits can be tolerated. Repeatable cash flow is what will determine whether 2026 can sustain the current pace.
US500 (D1 timeframe)
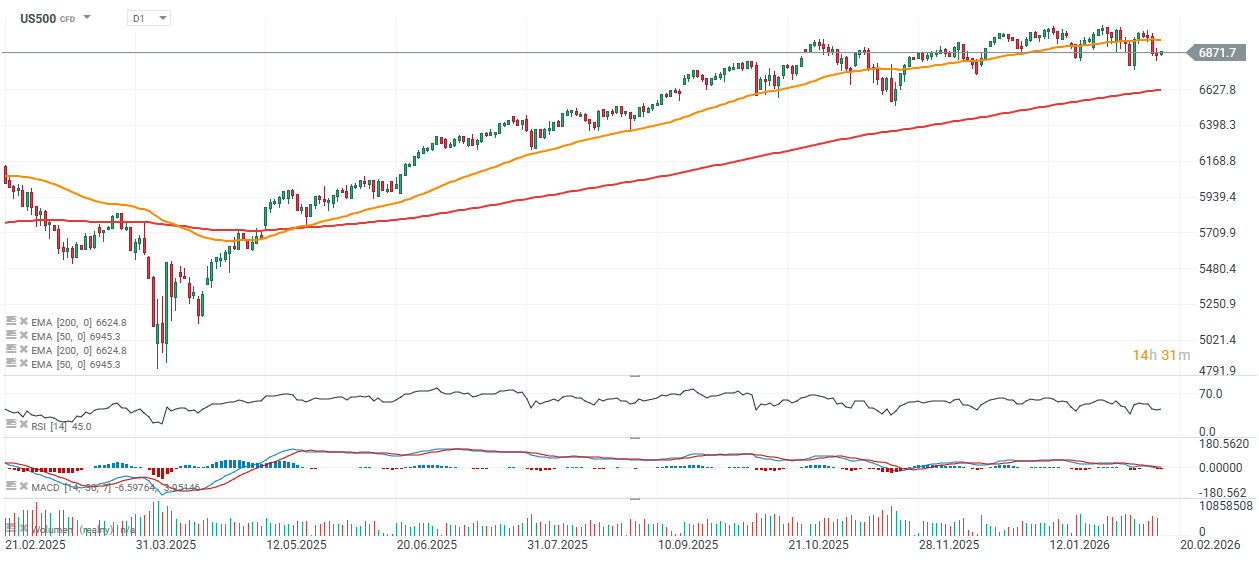
Source: xStation5

Chart of the Day: AI supports gains – can Tesla and Google sustain them? (22.07.2026)

Economic Calendar: Time for Tesla and Google Earnings (22.07.2026)

Morning Wrap: AI companies and gold back in favour? (22.07.2026)

Daily Summary: Semiconductors Rise in the Shadow of Geopolitical Turmoil