
Summary:
-
US markets little changed ahead of Wall Street open
-
August has been a solid month of gains for all 3 major indices
-
US500 set for 5th consecutive monthly gain
Today marks the final trading day in August, and it’s been another good month for US stock market bulls with all 3 major indices setting on solid gains. The US500, US100 and US30 are all trading not far from where they ended last night and it could be worthwhile keeping a close eye on them this afternoon for any month-end flows.
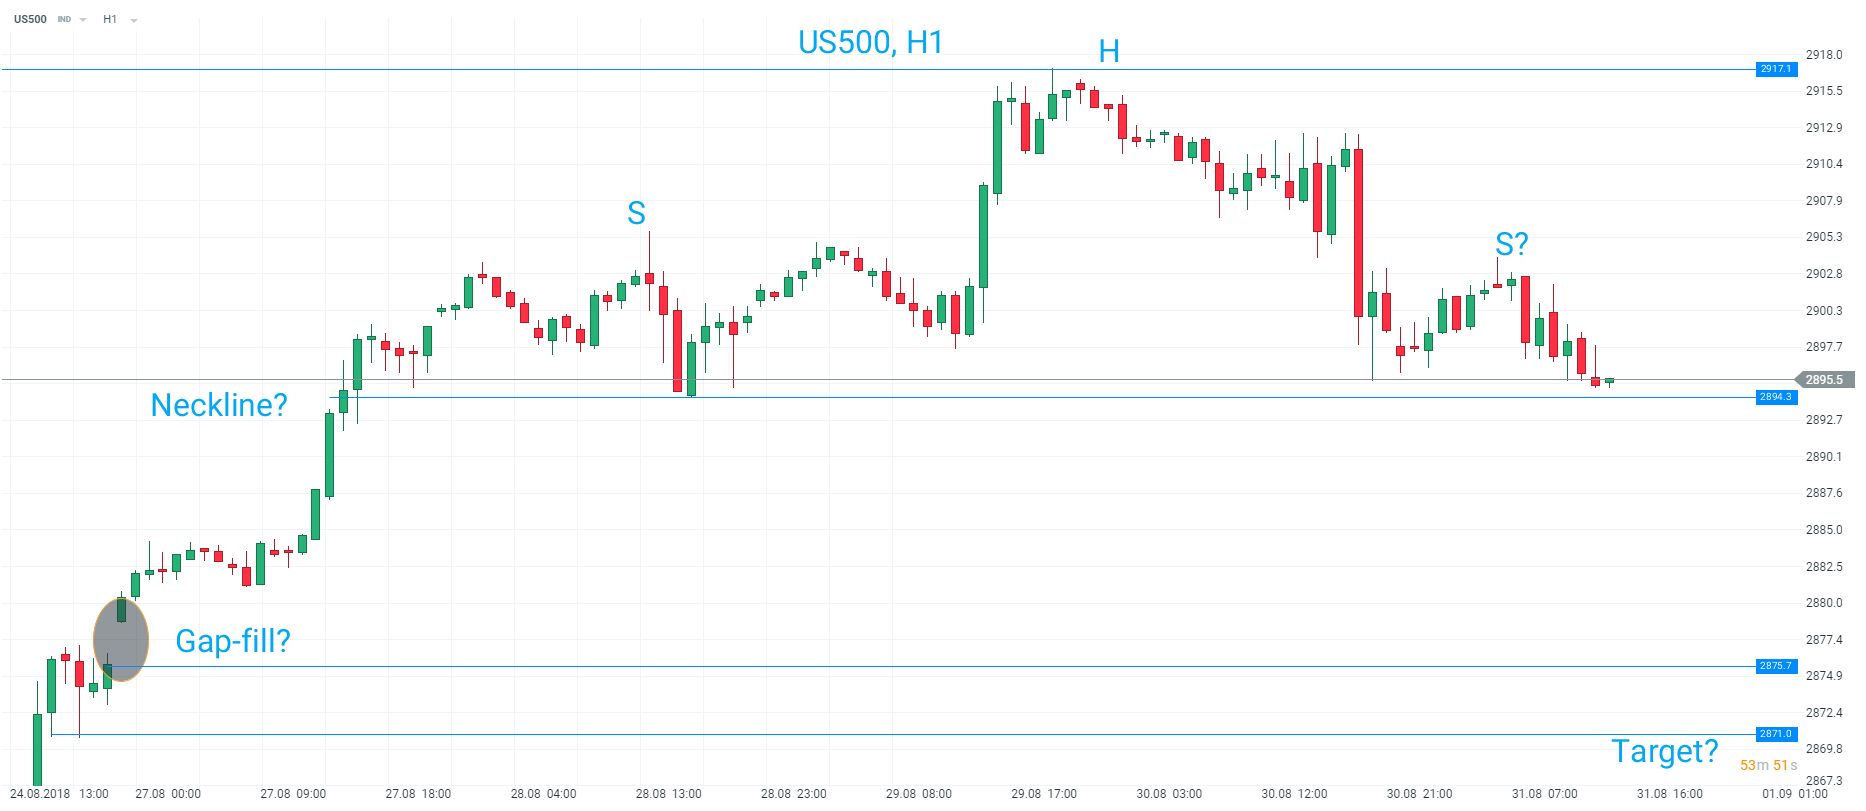
The US500 could be carving out a possible inverse head and shoulders setup, with the head coming at the record high of 2917 and a neckline at 2894. A break below 2894 would target a symmetrical move to 2871 from a textbook perspective but it may be deemed prudent to look for 2876 as a more cautious target which would represent a gap-fill from the start of the week. Source: xStation
Thursday actually may have marked something of a reversal for the US500 with the day’s trade totally engulfing the range seen on Wednesday. Recent all-time highs at 2918 are now a pretty obvious place to look for resistance while the prior breakout level from 2878 could offer support if price pulls back further. Most trend identification tools still point higher and it would require at least a daily close back below 2878 before shorts can get their hopes up that this is anything other than a small pullback in the prevailing uptrend.
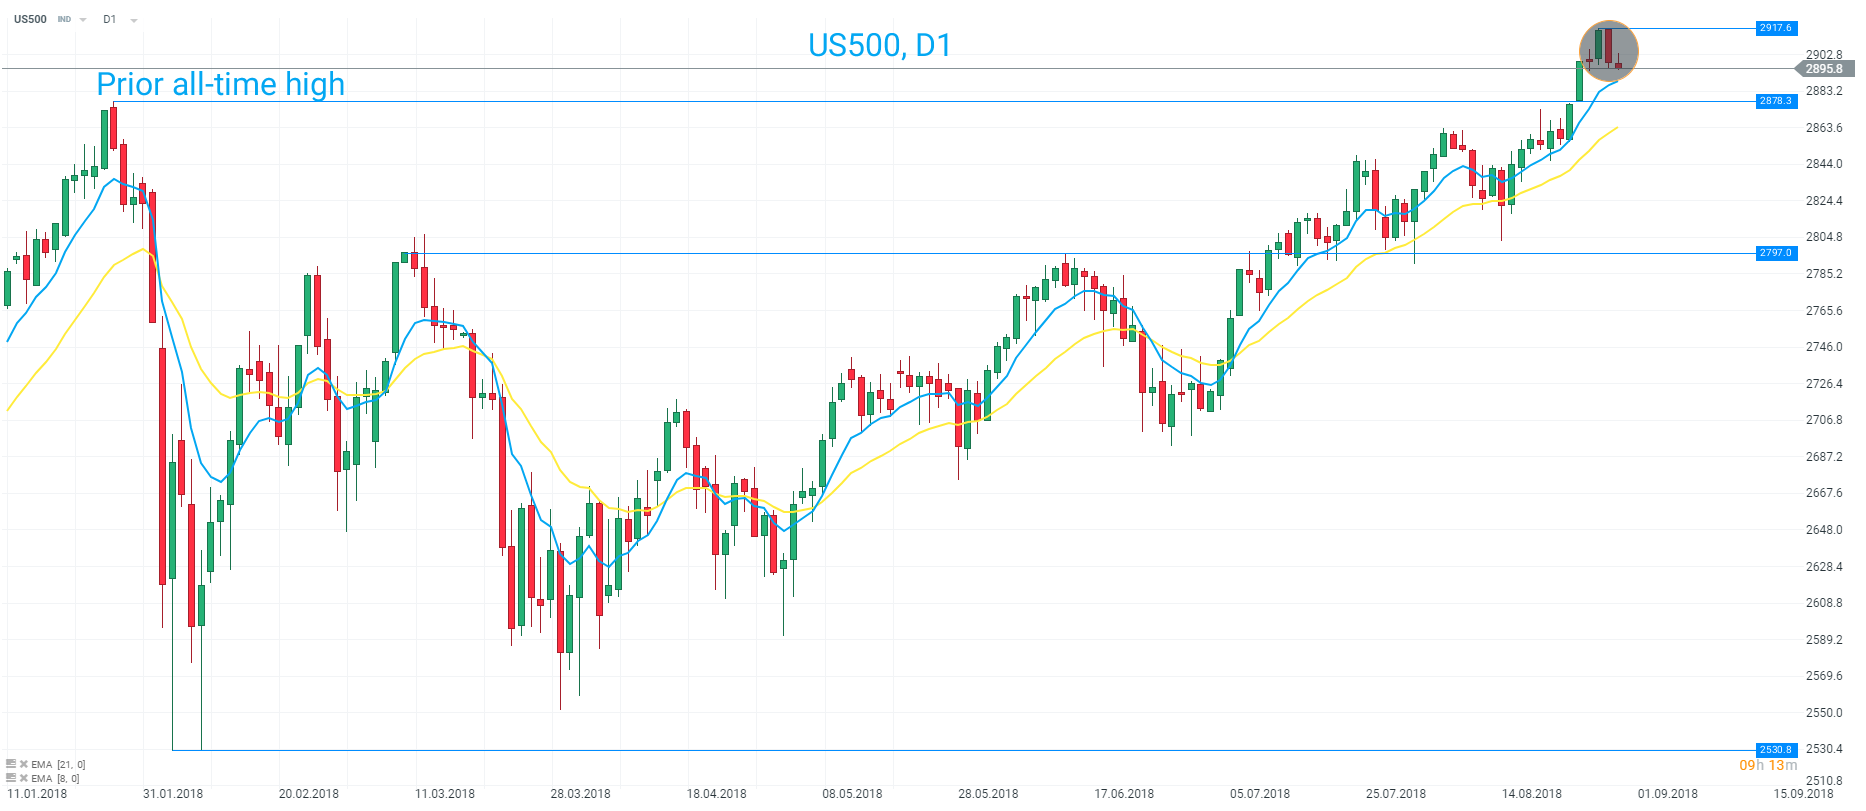
US500 printed a bearish engulfing pattern on D1 yesterday but the uptrend remains in tact according to the EMAs. Record highs at 2918 may be viewed as resistance while support could come in at the breakout level around 2878. Source: xStation
Seeing as today is month-end it may be a good time to look at the MN candles of the major US indices beginning with the US500.
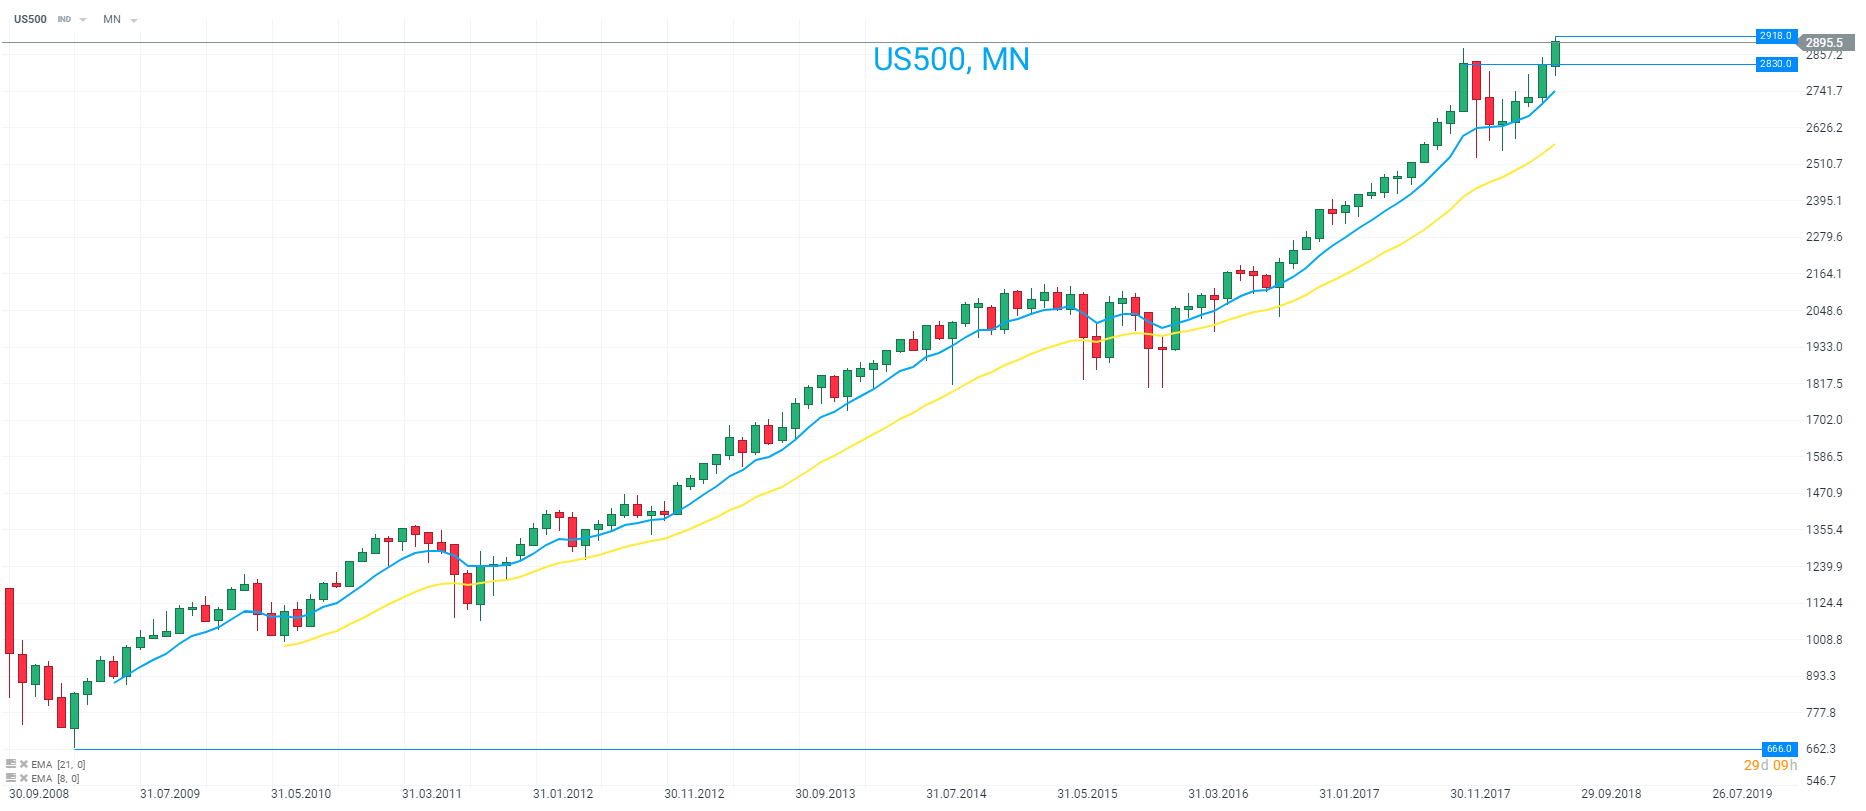
The US500 is on track for a 5th consecutive month of gains and also set to post its highest ever monthly close after breaching the January high of 2830. The market now appears to be looking to set off higher once more after a few months of consolidating and price remains in a clear uptrend. Source: xStation
US100
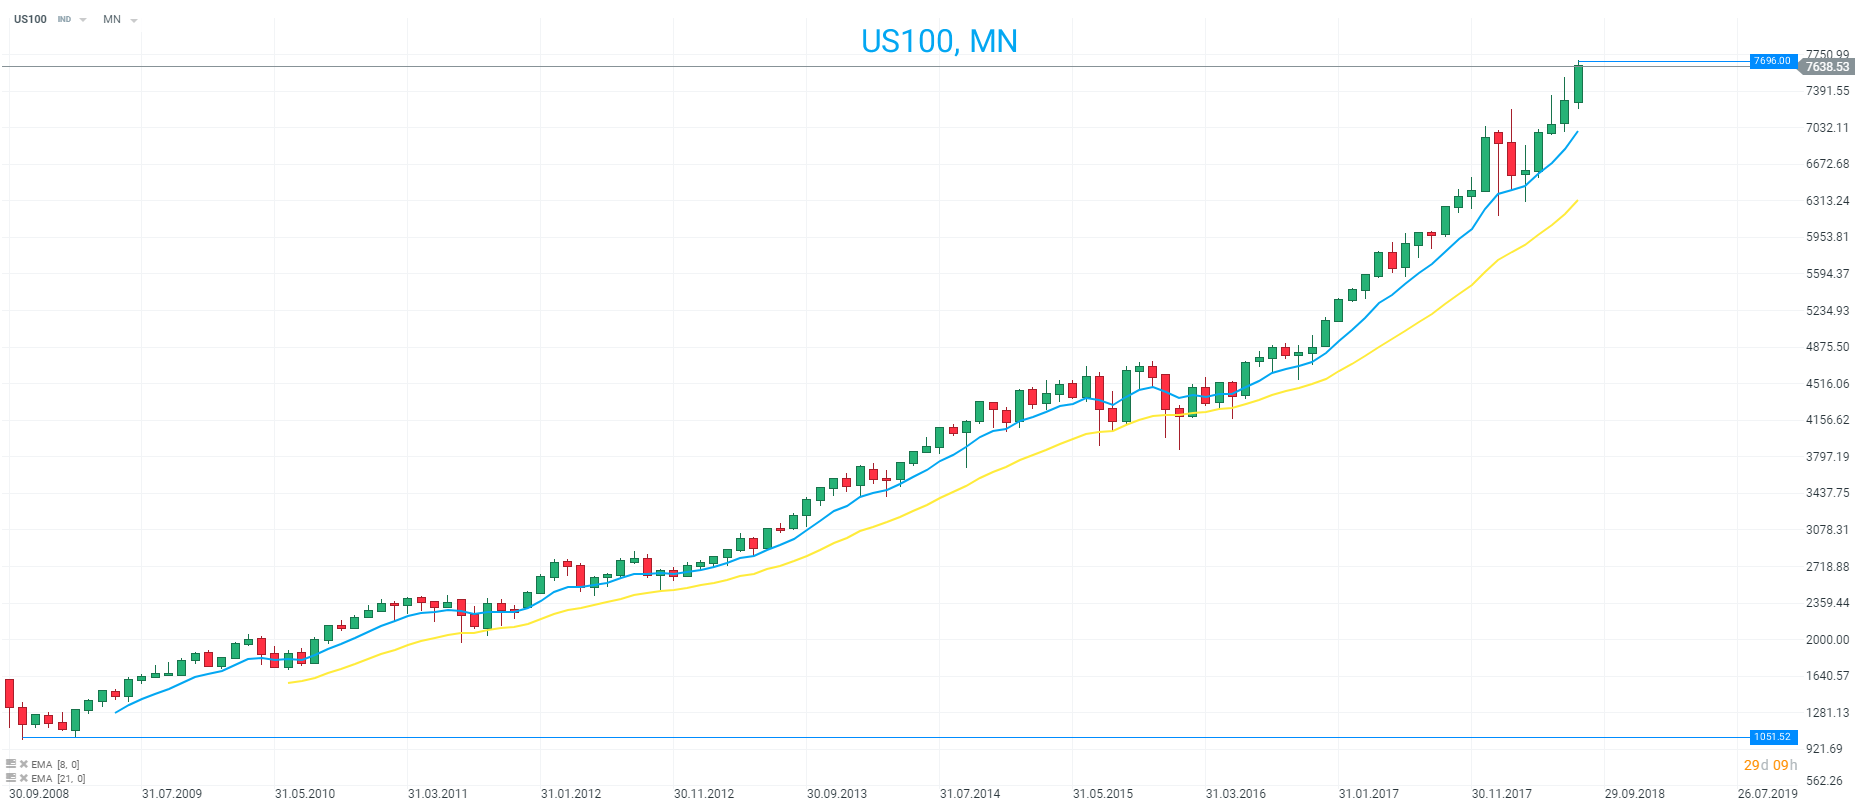
A large bullish candle can be seen in the US100 on a monthly timeframe, with the market also set for a 5th consecutive gain. The previous 2 candles had shown fair-sized wicks above which could have been interpreted as selling pressure but the current candle looks stronger and is set for a record monthly closing high as well as the largest monthly gain since January. Source: xStation
US30
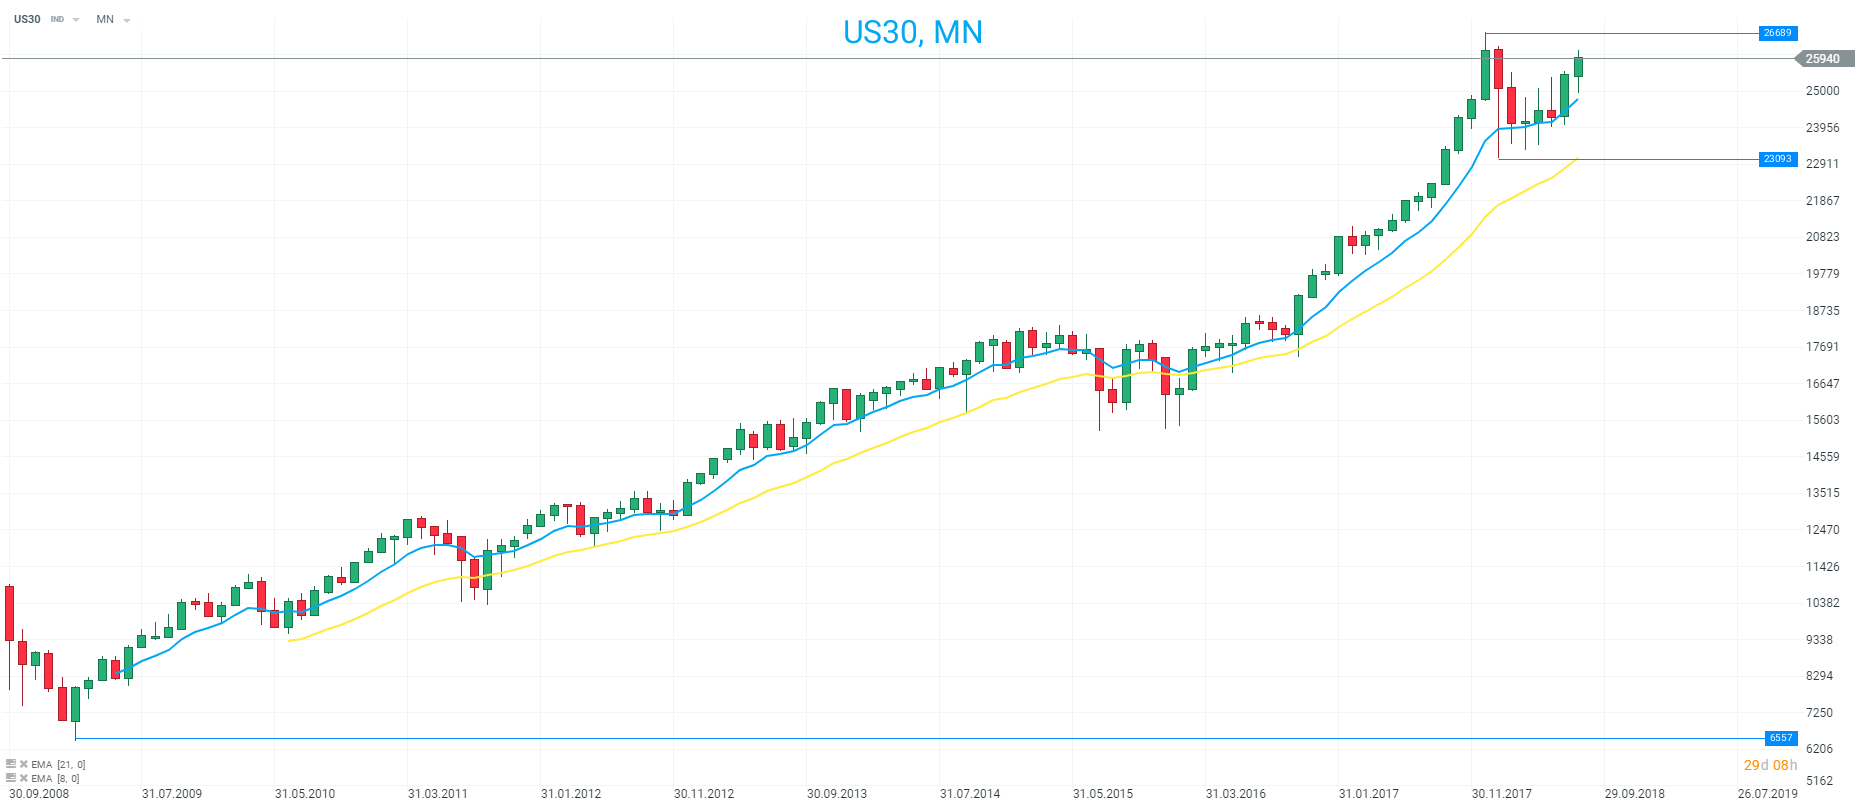 The US30 remains the laggard of the three with price not making a new record high in August and it would need to go some before the closing bell to post a record close. On the upside price has pulled back up away from the 8 EMA, but until it takes out the prior highs of 26690 then the potential for gains are fairly limited. Source: xStation