
It is worth noting that there was a situation in which WTI oil broke through the important 200-session average. Let's analyse a situation where such a breakout from a downtrend has rather occurred since 2016. We assume that the breakout through the 200-session average occurred in a situation where the 25- and 50-session averages are below the 200-session average.
2016:
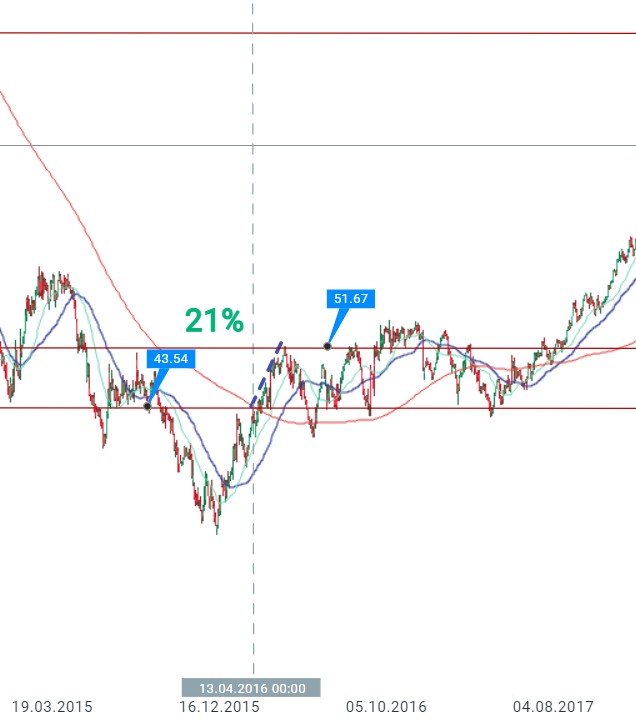
In April 2016, after a long downtrend following the breakout of the 200 SMA, the upward movement was as much as 21%, nevertheless the price then fell into a consolidation roughly in the range of $43-$52 per barrel. However, the start of a longer upward movement occurred 1.5 years later. Source: xStation5
2019:
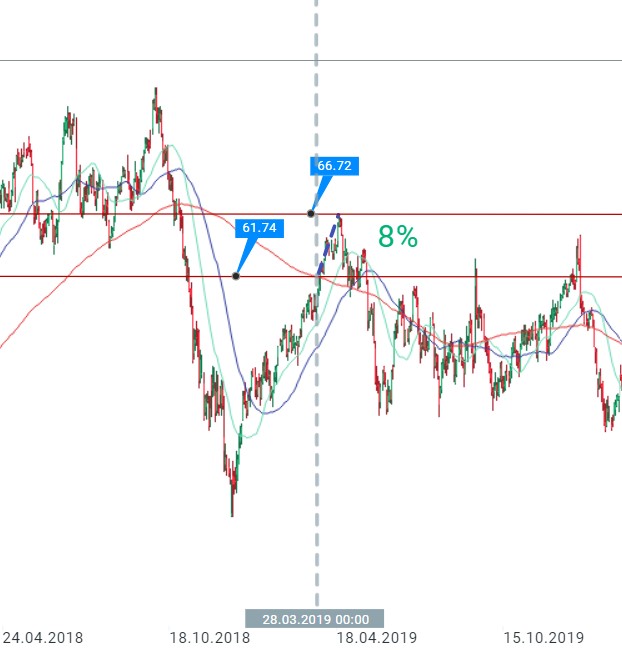
In March 2019, there was only an 8% upward movement after the 200 SMA was pierced, after which the price fell into a consolidation between $50 and $62 per barrel. Source: xStation5
2019 i 2020
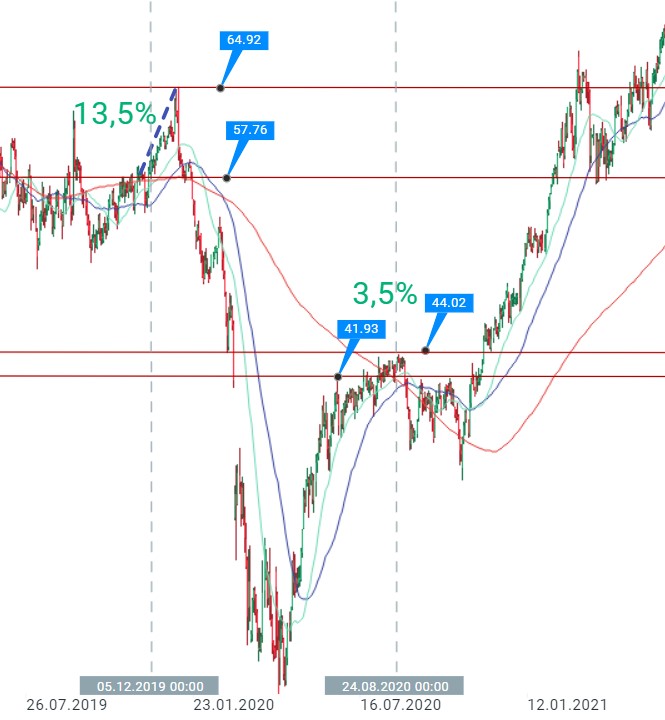
At the end of 2019, there was a breakout from the previously mentioned consolidation and the price then rose by around 13.5%. However, the price then moved sharply downwards, which was related to Covid. Later in August 2020, there was a minor breakout of the 200 SMA at 3.5%. This was followed by a short consolidation bounded from above by $44 and then a long upward wave started. Source: xStation5
July 2023
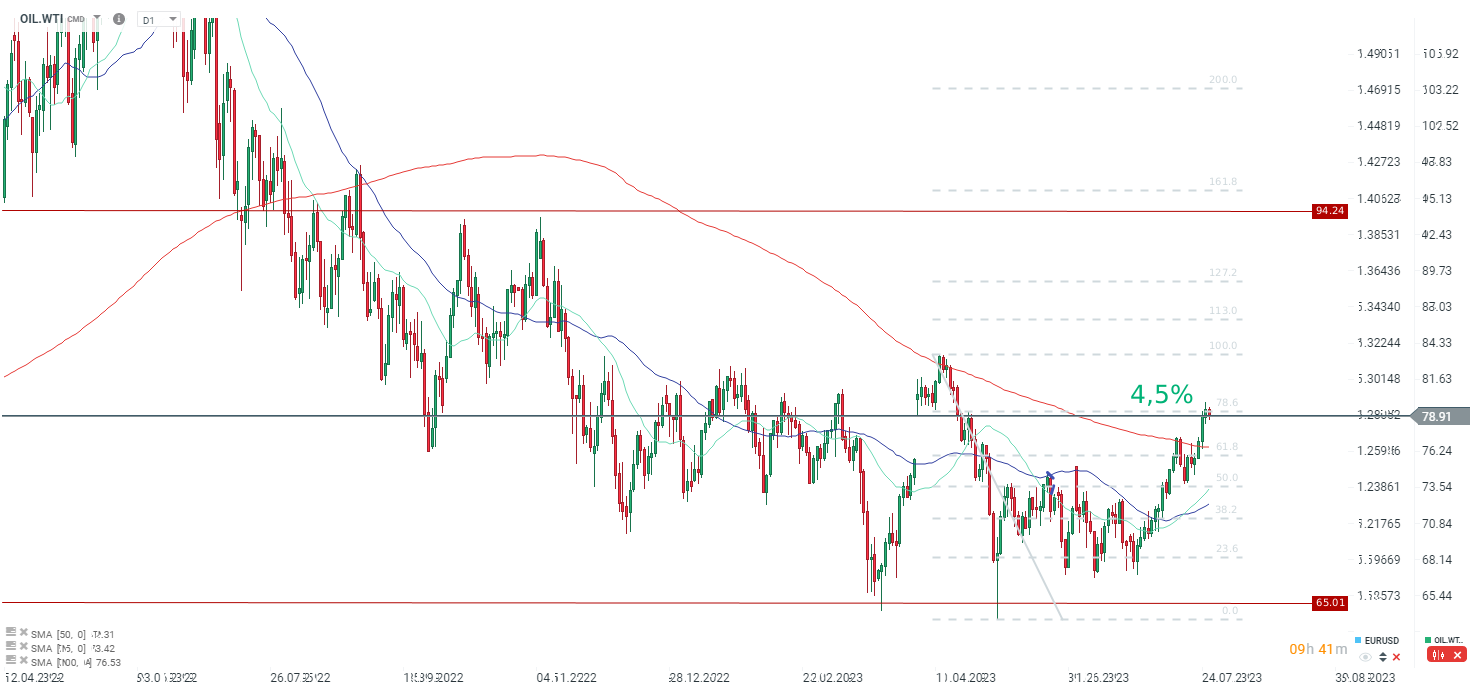
After the breakout of the 200 SMA, the upward movement was around 4%. Nevertheless, it seems that the current move should be somewhat larger than this minor breakout, given the previous massive declines and the fundamental situation in which supply is quite tightly constrained. Additionally, if the dollar is oversold again, the upward movement could reach as high as $85 per barrel, where a move of 10% would fall from the 200 sma cut. Source: xStation5

Silver breaks above $59 and attracts capital again. Gold remains in the shadow of its younger sibling

🛢️Brent crude retreats from $90

Economic Calendar: Inflationary Pressure in Germany and Canada Alongside Poland's Economic Data Pack

Morning Wrap: Oil Climbs Back Above $90 as Chinese AI Weighs on Tech Stocks.