
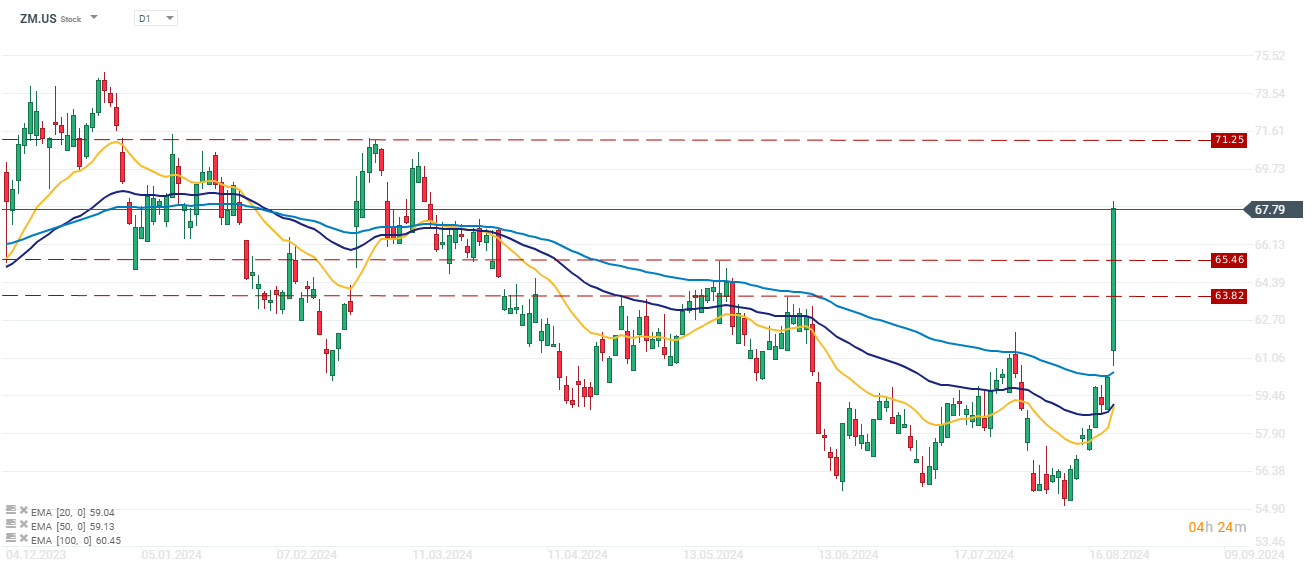
Zoom reported stronger-than-expected results for 2Q24. In response to the company's report, the stock shot up more than 12%, approaching its highest levels since May of this year. The company is about 5.2% away from this year's March highs.
Source: xStation
Zoom reported revenue of $1.16 billion, up 2.1% year-on-year. The growth rate is 0.4 p.p. higher than the company's previous projections for the full year 2024. At the same time, the company reported a significant improvement in adjusted earnings per share, which came in at $1.39 (versus $1.34 a year earlier and an expected drop to $1.22 by market consensus).
Buoyed by the strong sales performance, the company raised its forecast for the full fiscal year 2024/25 by $20 million, projecting a revenue growth rate of 3% y/y.
The company also reported an improvement in free cash flow, where it recorded $365.1 million against an estimated $268.7 million.
For 3Q24, the company expects earnings per share in the range of $1.29-1.31 (versus analysts' expectations of $1.29). Expected sales are also higher than consensus estimates. The company expects revenues in the range of $1.16 billion-$1.165 billion (the mid figure of $1.163 billion beats analysts' predictions by $25 million).
The company's results look very solid, which is especially important for the company, as the anticipated stronger rebound in earnings will likely not occur until late 2024/early 2025, when the company's strategic decisions to consolidate the services it offers and develop the platform from a video communications app into a comprehensive office work tool supported by artificial intelligence will finally reap results. Until then, the improvement in results provides a solid foundation for anticipation regarding the effects of the changes being made.

The company's forward P/E ratio of 12.9x even after a strong increase in today's session further places Zooma's stock price well below the average for the past 3 years. What's more, compared to the sector as a whole and the Russell 1000 index, the value of the forward P/E ratio continues to be below the 3-year averages.

The value of the forward P/E ratio compared to the average for 3 years (top chart), comparison of the relative value of the ratio to the Russell 1000 Technology index (middle chart), comparison of the value of the ratio to the Russell 1000 index (bottom chart). Source: Bloomberg Finance L.P.
2Q24 RESULTS:
- Revenue $1.16 billion, +2.1% y/y, estimate $1.15 billion
- Adjusted EPS $1.39 vs. $1.34 y/y, estimate $1.22
- Free cash flow $365.1 million, +26% y/y, estimate $268.7 million
- Cash and cash equivalents $1.54 billion, estimate $2.02 billion
- TTM net dollar expansion rate for enterprise customers 98%, estimate 97.9%
- Customers contributing more than $100,000 in trailing 12 months revenue 3,933, estimate 4,001

Morning Wrap: Markets Are Trying to Rebound Following Big Tech Earnings and the Fed's Decision

Meta shows how to lose almost 10% despite record sales due to AI development

Microsoft shows how to make money on data centers. AI investments are starting to pay off

Meta Preview: Will Advertising Fund Its AI Ambitions?