



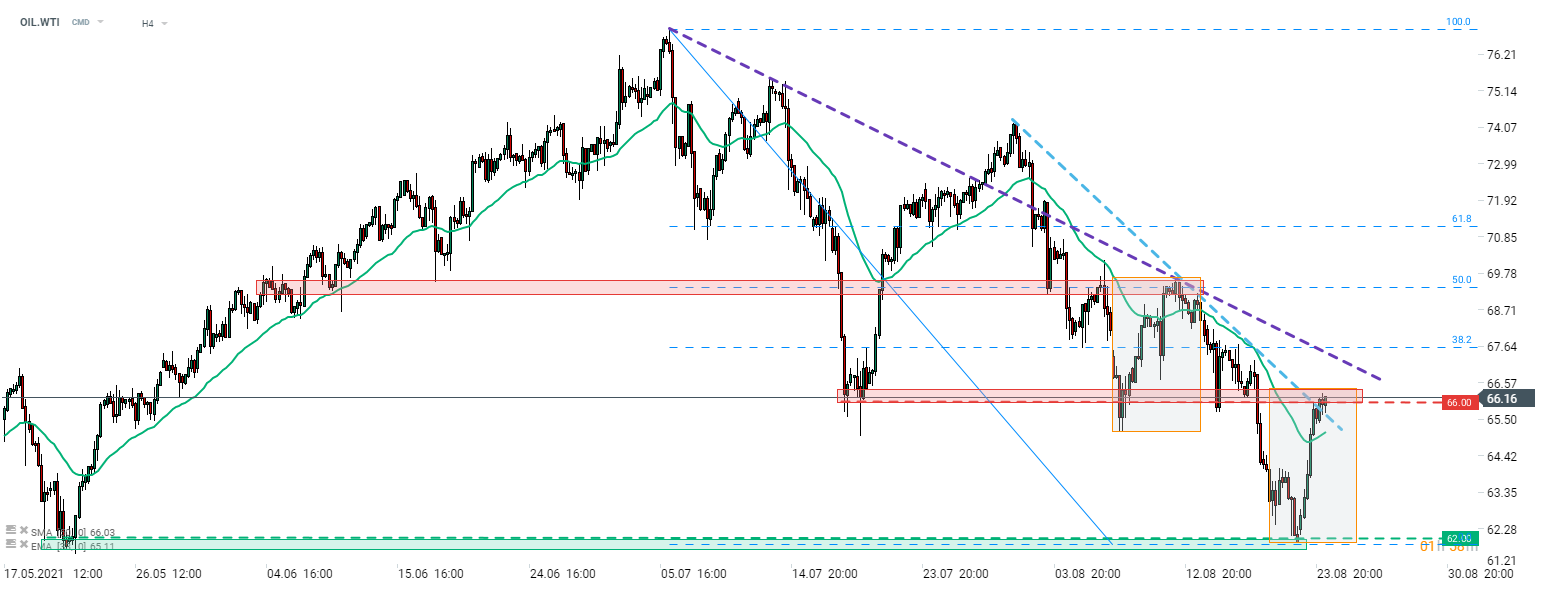
Equity and commodity markets rallied amid broad risk-on moods. Oil was one of the top gainers with Brent and WTI gaining over 5%. That was a major reversal following a month of weakness in oil prices. Taking a look at the OIL.WTI chart, we can see that the price has reached a resistance zone at $66.00. One of the short-term downward trendlines can be found in the same area as well as the upper limit of a local market geometry. Break above this zone would pave the way for the test of the second trendline, currently near 38.2% retracement of recent correction ($67.60 area). Should the upward move continue, the major resistance is marked with a recent local high at 50% retracement ($69.50) and break above this zone would hint at short-term trend reversal
 Source: xStation5



Daily Summary: Rising inflation weighs on markets, semiconductors suffer most (14.10.2026)


US Open: CPI reading weighs on American indices (14.10.2026)



Inflation data causes market havoc



Market Wrap: ASML lifts tech sentiment, EU yields pull back
This content has been created by XTB S.A. This service is provided by XTB S.A., with its registered office in Warsaw, at Prosta 67, 00-838 Warsaw, Poland, entered in the register of entrepreneurs of the National Court Register (Krajowy Rejestr Sądowy) conducted by District Court for the Capital City of Warsaw, XII Commercial Division of the National Court Register under KRS number 0000217580, REGON number 015803782 and Tax Identification Number (NIP) 527-24-43-955, with the fully paid up share capital in the amount of PLN 5.869.181,75. XTB S.A. conducts brokerage activities on the basis of the license granted by Polish Securities and Exchange Commission on 8th November 2005 No. DDM-M-4021-57-1/2005 and is supervised by Polish Supervision Authority.