
US indices are trading in a local sideways move today. Looking at US500 chart, one can see a head and shoulders formation which often heralds a trend reversal. The key support zone is marked with the green colour (2630 pts) - neckline of head and shoulders pattern as well as previous price reactions can be found there. Nevertheless, as long as the price sits above it, sentiment remains bullish. However, one should be aware that in case of a break below the aforementioned support, downward move may accelerate.
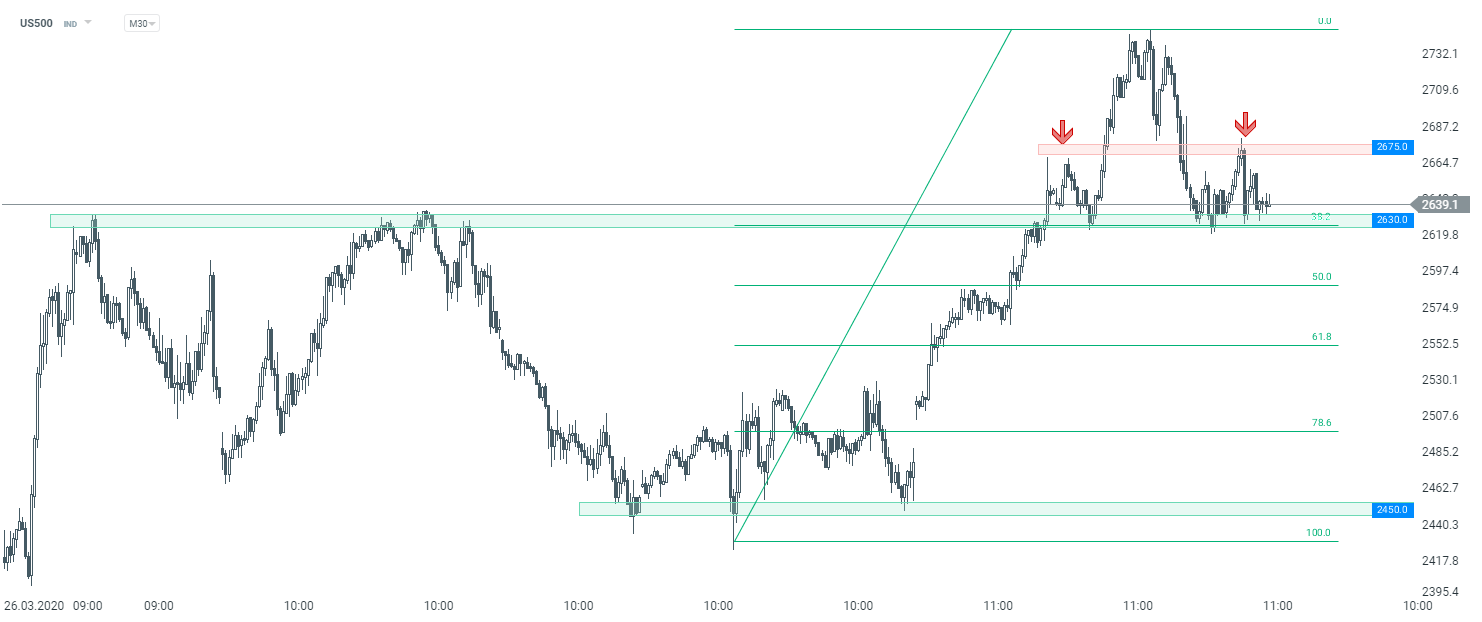 US500 M30 interval. Source: xStation5

Daily Summary: Wall Street Regains Ground; Another Intervention in the Yen Market❓

Three Markets to Watch Next Week (July 31, 2026)

What July can tell us about where stocks go next

Market Wrap: European equities at 3-week highs! Apple dips in US premarket!
This content has been created by XTB S.A. This service is provided by XTB S.A., with its registered office in Warsaw, at Prosta 67, 00-838 Warsaw, Poland, entered in the register of entrepreneurs of the National Court Register (Krajowy Rejestr Sądowy) conducted by District Court for the Capital City of Warsaw, XII Commercial Division of the National Court Register under KRS number 0000217580, REGON number 015803782 and Tax Identification Number (NIP) 527-24-43-955, with the fully paid up share capital in the amount of PLN 5.869.181,75. XTB S.A. conducts brokerage activities on the basis of the license granted by Polish Securities and Exchange Commission on 8th November 2005 No. DDM-M-4021-57-1/2005 and is supervised by Polish Supervision Authority.