
A neutral overview of notable semiconductor ETFs to watch in 2027, comparing their strategies, costs, concentration, key differentiators, and sector risks.
A neutral overview of notable semiconductor ETFs to watch in 2027, comparing their strategies, costs, concentration, key differentiators, and sector risks.


This guide highlights the best semiconductor ETFs worth watching in 2027 and explains the mechanics of investing in chip manufacturers. Market participants can track dozens of these funds to monitor global tech performance, with typical expense ratios (TER) hovering around 0.35%. Driven by aggressive artificial intelligence infrastructure spending and inherent cyclicality, these sector-specific funds are an important part of global investors' portfolios in 2027.
Key takeaways
-
What is a semiconductor ETF: These financial vehicles offer direct market exposure to a basket of chip designers, foundries, and equipment manufacturers, usually benefiting from AI infrastructure in a single trade.
- Standardized evaluation criteria: Investors evaluate funds by consistently comparing their expense ratio (TER), assets under management (AUM), and top-10 concentration.
- Primary sector risks: The semiconductor market experiences severe boom-and-bust cycles and extreme concentration risk, meaning a few mega-cap companies often dictate broad index performance.
What is a semiconductor ETF and what makes one worth watching?
A semiconductor ETF is an exchange-traded fund that provides exposure to a basket of chip companies, and its viability for observation depends on measurable metrics like the expense ratio (TER), assets under management (AUM), and weighting methodology. These index funds capture the entire semiconductor value chain, encompassing chip design firms, physical manufacturing foundries, and the suppliers of advanced lithography equipment.
Investors exploring what an ETF is often analyze these specialized products to gain targeted exposure to technology infrastructure without selecting individual stocks. The performance of any semiconductor ETF relies heavily on the specific index it tracks, such as the MSCI ACWI IMI Semiconductor & Semiconductor Equipment Index or the MarketVector US Listed Semiconductor Capped Screened Index.
Evaluating whether a chip ETF is worth watching requires a consistent analytical framework across several standardized criteria. The most critical factors include the expense ratio (which dictates the ongoing management cost), the total assets under management (AUM), which indicates market liquidity,, and the top-10 holding concentration. A fund heavily concentrated in a few mega-cap stocks carries a vastly different risk profile than an equal-weight fund holding the exact same underlying companies.
VanEck Semiconductor ETF (SMH.UK)
The VanEck Semiconductor ETF (SMH.UK) tracks the MarketVector US Listed Semiconductor 10% Capped Screened Index and provides targeted exposure to the largest US-listed chip companies based on market capitalization.
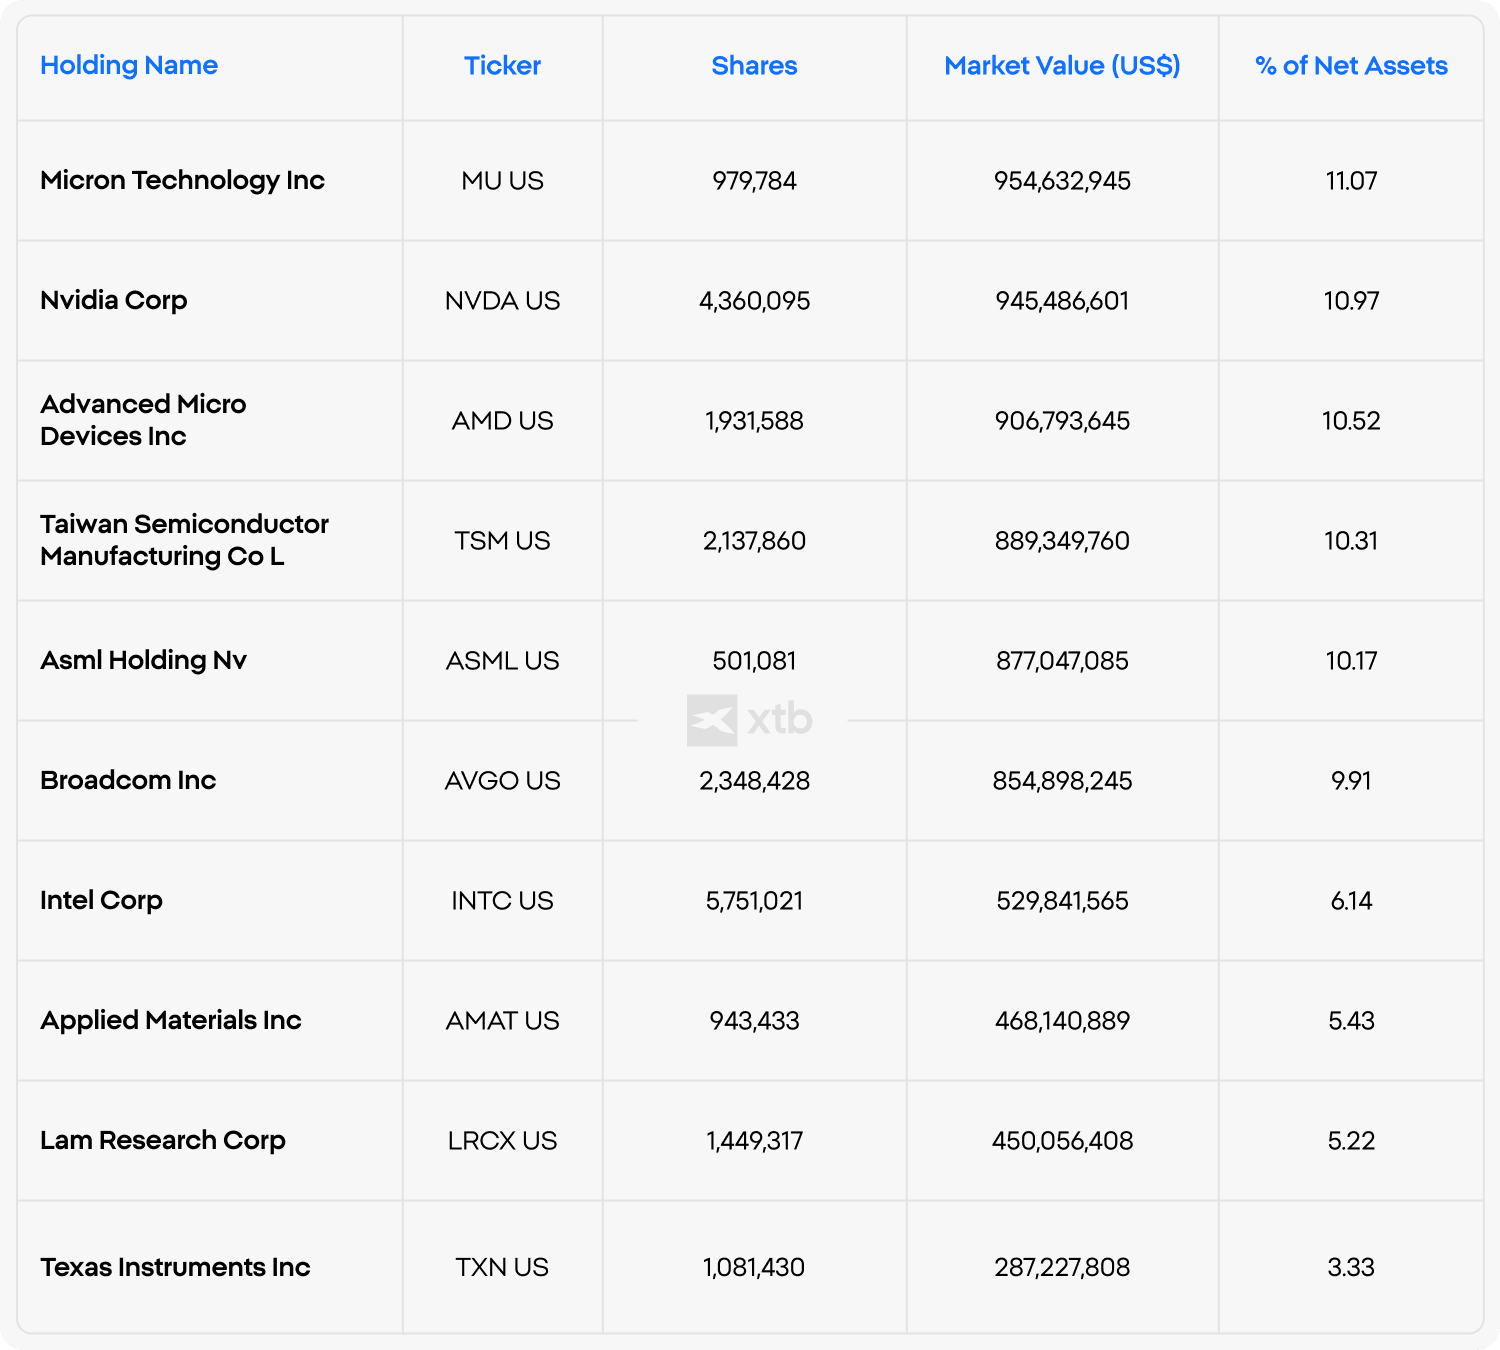
This cap-weighted fund represents one of the largest and most liquid options in the market, functioning as a primary benchmark for the US semiconductor industry. Trading under the ticker SMH, the VanEck manages approximately $7.05 billion in assets under management for institutional and retail investors. The fund charges an expense ratio (TER) of 0.35% and holds exactly 25 US-listed equities.
SMH stands out primarily due to its massive liquidity and deep concentration in industry leaders. The top 10 holdings account for nearly 83% of the total portfolio weight, making it highly sensitive to the performance of top-tier AI and equipment manufacturers. The largest positions in its portfolio are Micron, Nvidia, AMD, TSMC and ASML - each stock has approximately 10 - 11% weight in the index. Investors analyzing this semiconductor ETF must remember that past performance does not guarantee future results, especially given the sector's historical volatility.
MSCI Global Semiconductor (SEC0.DE)
The European version of iShares MSCI Global Semiconductor UCITS ETF (SEC0.DE) tracks the MSCI ACWI IMI Semiconductor & Semiconductor Equipment Index and differs from US-focused funds by providing broad international exposure across developed and emerging markets. The underlying MSCI universe covers 23 developed and 24 emerging markets.
Unlike US-centric portfolios, this global semiconductor ETF captures a wider geographical slice of the supply chain, incorporating major Asian and European semiconductor companies. The fund carries an expense ratio of 0.35% and manages around $3.55 billion in AUM. The underlying index contains approximately 262 constituents, offering a much broader net than typical 30-stock semiconductor indices.
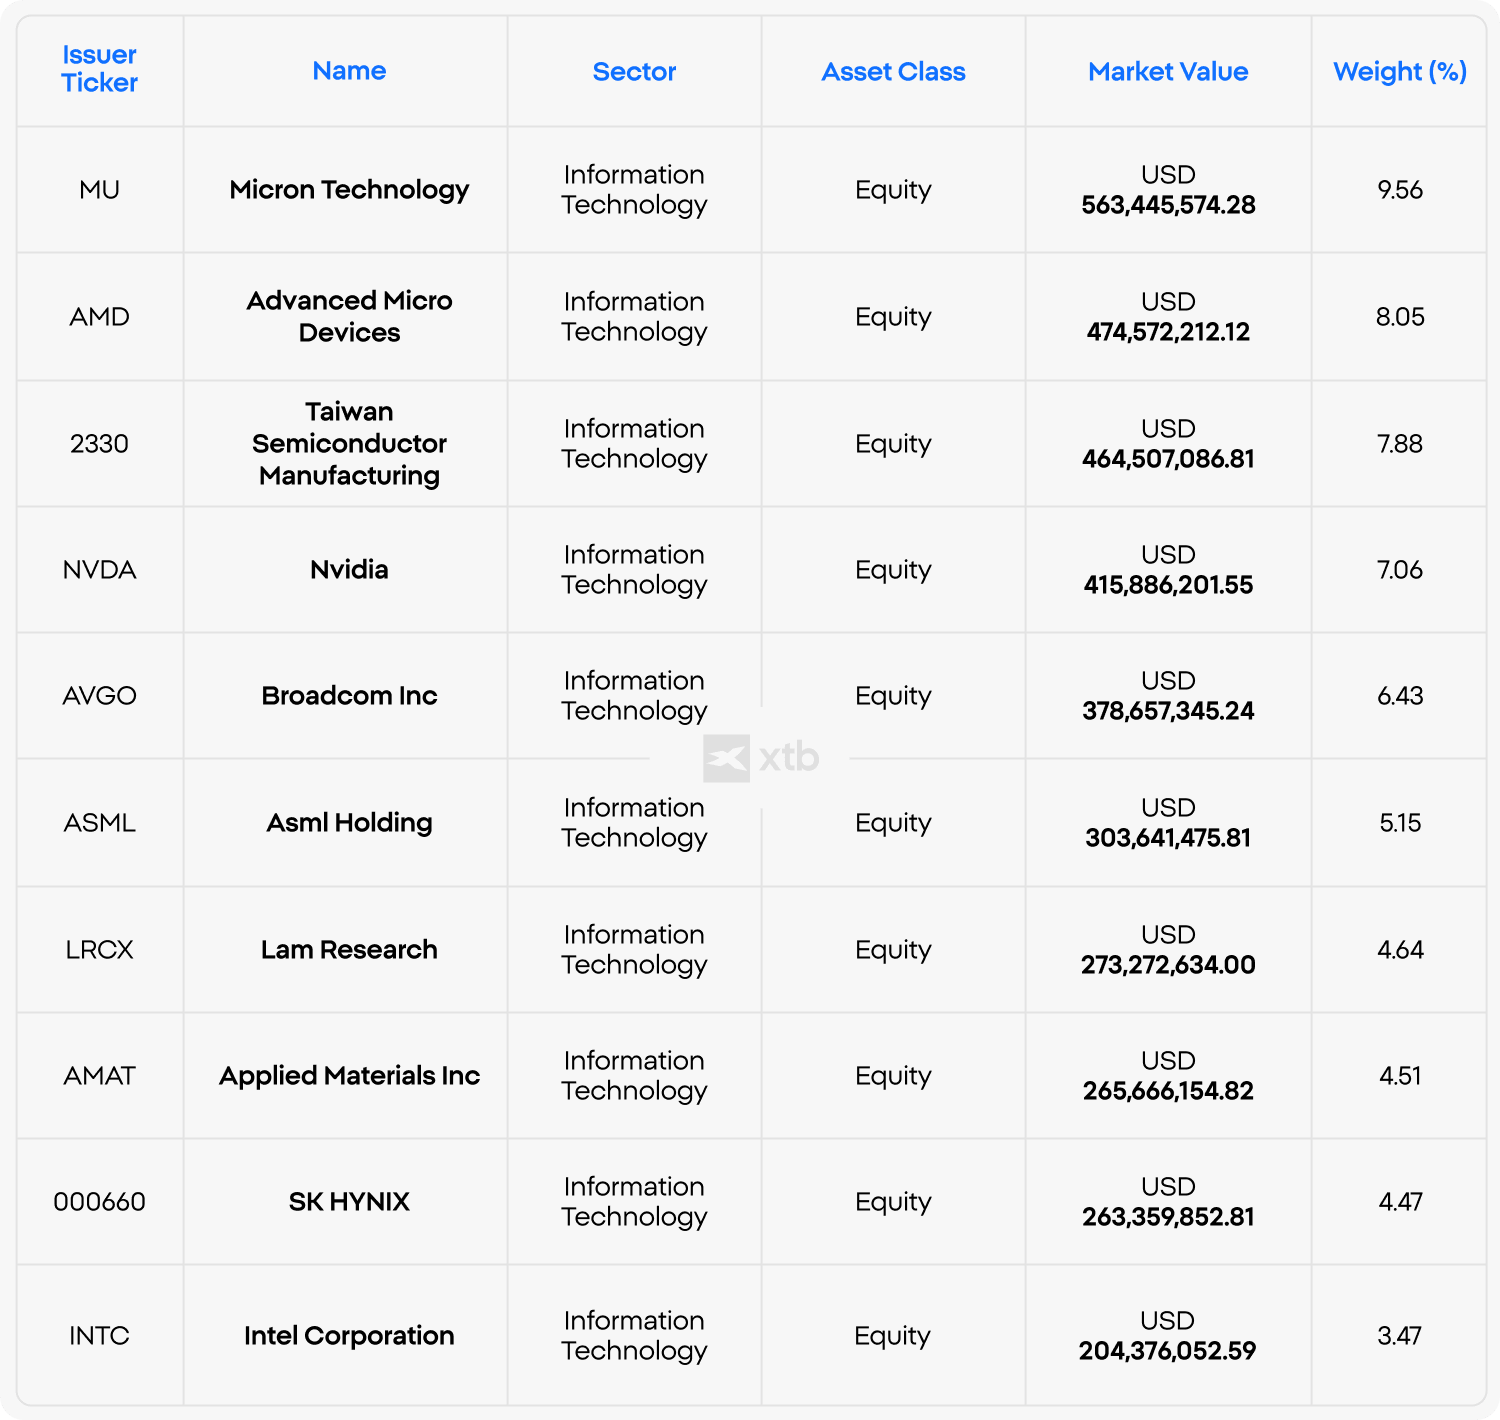
The primary differentiator for SEMI is its significant geographical and business-model diversification. Alongside US companies such as Micron, AMD, Taiwan Semiconductor (TSMC), Nvidia and Broadcom, the portfolio includes ASML, Lam Research, Applied Material, SK Hynix and Intel providing exposure to foundry manufacturing, memory chips and semiconductor equipment outside the United States.
According to MSCI’s latest July composition, the ten largest index constituents represented roughly 60% of the benchmark, so the ETF remains relatively concentrated at the top despite its large number of holdings. This structure allows market participants to observe the global semiconductor sector rather than just companies headquartered in North America.
Amundi MSCI Semiconductors ESG Filtered (LSMC.DE)
The Amundi MSCI Semiconductors ESG Filtered UCITS ETF is a physically replicated ETF that aims to track the MSCI ACWI Semiconductors & Semiconductor Equipment ESG Filtered Net Total Return Index, representing a highly specialized profile focused on the global semiconductor industry. Designed for long-term sector exposure rather than short-term leveraged trading, this ETF uses physical replication to track the price movements of the underlying semiconductor index. The fund charges an ongoing cost ratio of 0.35% and commands roughly $2.16 billion in AUM as of 31 July 2026. Because it tracks a sector-specific index, concentration effects can lead to substantial volatility during semiconductor downturns.
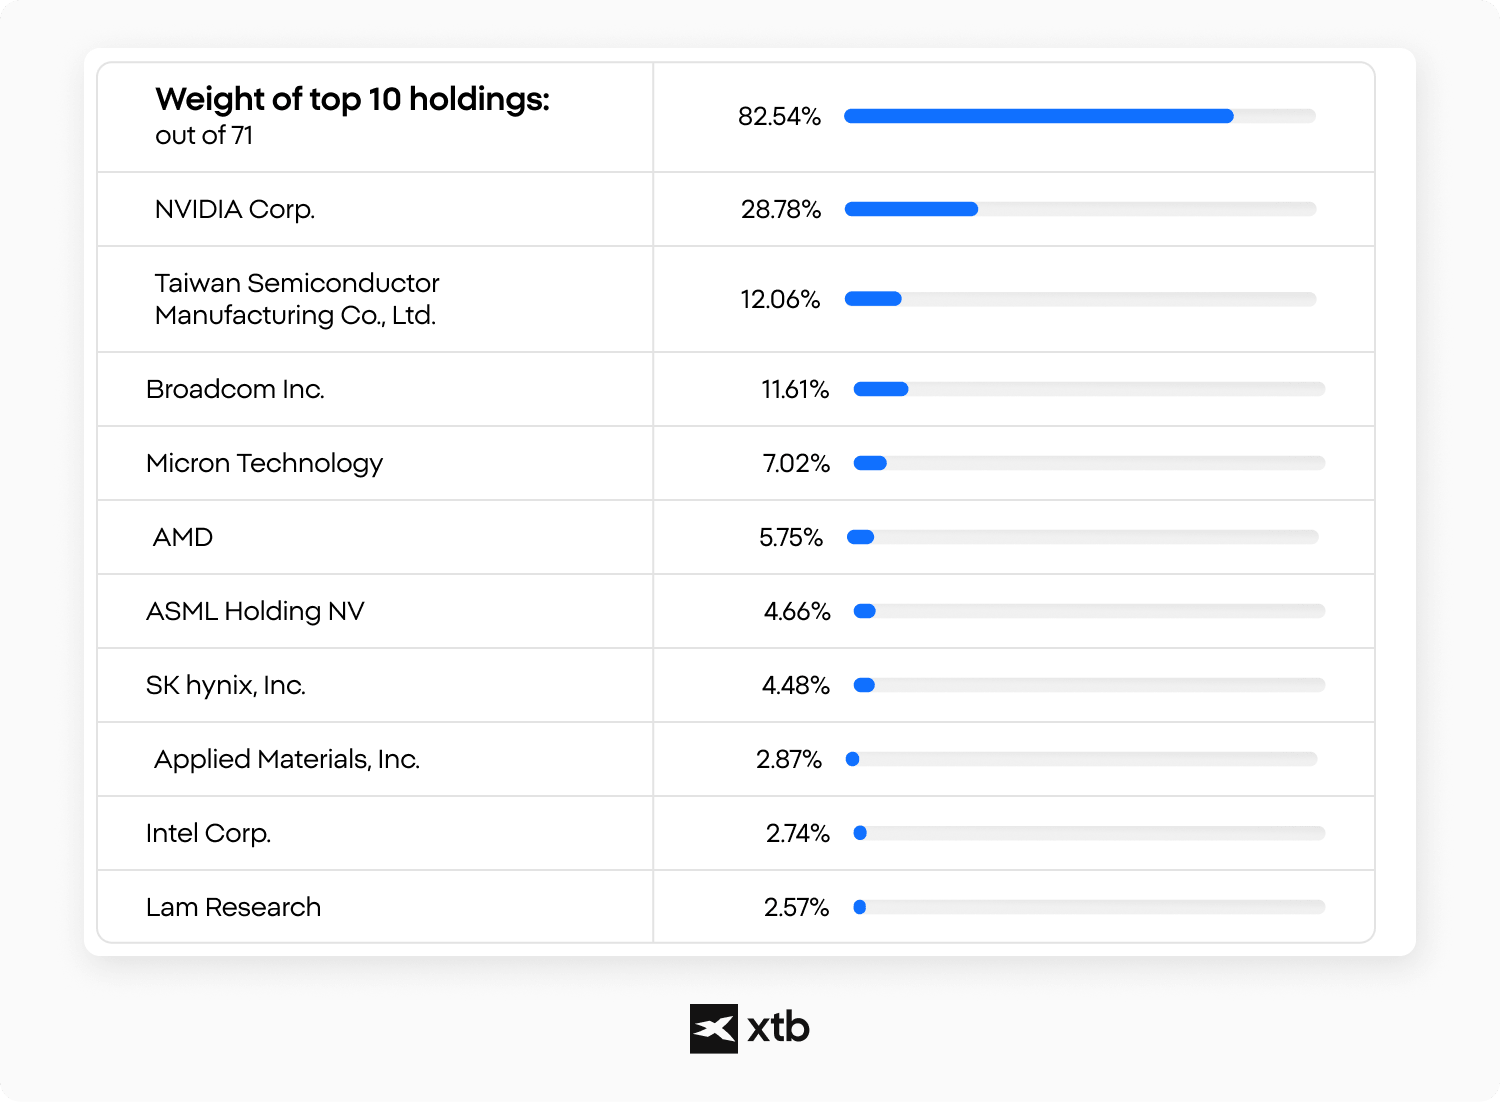
The ETF currently holds around 71 stocks, although its portfolio is heavily concentrated in the industry’s largest companies. As of August 2027, the top 10 holdings accounted for approximately 82.5% of the portfolio, meaning that performance is largely driven by a relatively small group of semiconductor leaders. Nvidia alone represented almost 30% of assets, followed by Nvidia at almost 29%, Taiwan Semiconductor Manufacturing (TSMC) at roughly 12% and Broadcom at around 11.6%.
The remaining major positions included Micron Technology at approximately 7%, Advanced Micro Devices at 5.7%, ASML at 4.6%, SK Hynix at 4.5%, Applied Materials at 2.9%, Intel at 2.7% and Lam Research at 2.5%.The Amundi MSCI Semiconductors ESG Filtered ETF stands out for its targeted exposure to semiconductor manufacturers and equipment suppliers across developed and emerging markets. It might be suitable for investors seeking passive semiconductor sector exposure rather than broad-market diversification. However, its concentrated sector profile and high weighting toward Nvidia, TSMC and Broadcom mean that any systemic shock to semiconductor demand, AI capital expenditure, valuations or the largest individual holdings could result in significant drawdowns.
What drives semiconductor ETF performance and what are the risks?
The underlying demand for advanced computing power serves as the primary catalyst for the semiconductor sector. The rapid expansion of artificial intelligence (AI) infrastructure requires massive clusters of specialized processors, driving revenue for designers and equipment suppliers alike Semiconductor Industry Association Global Sales Report, 2026. However, the industry remains inherently cyclical; periods of intense capital expenditure are historically followed by inventory gluts and sharp revenue contractions, making semiconductor ETFs highly volatile compared to broad market indices.
Concentration risk stands out as a critical vulnerability for anyone observing a semiconductor ETF. In many cap-weighted funds, the top five companies can dictate the majority of the ETF's daily price movement.
Geopolitical tension between the US and China also poses a severe threat, particularly concerning Taiwan Semiconductor (TSMC). Because TSMC manufactures a vast majority of the world's most advanced chips, any disruption in the supply chain would immediately impact the valuation of nearly every global technology company. Always remember that past performance does not guarantee future results when assessing these cyclical risk factors.
How should you compare semiconductor ETFs?
Comparing semiconductor ETFs requires more than simply looking at past returns. Two funds that both provide exposure to the chip industry can have very different portfolio structures depending on the index they track, their weighting methodology, geographic allocation, and concentration in the largest holdings. A fund dominated by a handful of mega-cap semiconductor companies may behave very differently from a broader or equal-weighted ETF, even when both are classified as semiconductor sector funds.
Investors can therefore compare semiconductor ETFs using a consistent set of measurable criteria rather than focusing on a single metric. Expense ratio affects the long-term cost of holding the fund, while assets under management and trading liquidity can indicate its scale and market activity. Portfolio composition is equally important because the number of holdings, exposure to individual companies and geographic diversification determine how strongly the ETF depends on specific parts of the semiconductor industry.
So what should you watch for when comparing ETFs? Here is the breakdown:
- Expense ratio (TER): shows the annual cost of holding the ETF and can affect long-term returns.
- Assets under management (AUM) and liquidity: indicate the fund's size and how actively its shares are traded.
- Number of holdings: helps show whether the portfolio offers relatively broad or concentrated semiconductor exposure.
- Top-10 concentration: measures how much of the ETF depends on its largest semiconductor companies.
- Weighting methodology: determines whether larger companies dominate the portfolio or holdings receive more balanced weights.
- Geographic exposure: shows whether the fund focuses mainly on US-listed companies or also includes major Asian and European semiconductor producers.
How can you gain exposure to semiconductor ETFs?
Investors gain exposure to semiconductor ETFs through a standard brokerage account that provides access to exchange-traded funds, selecting specific instruments.
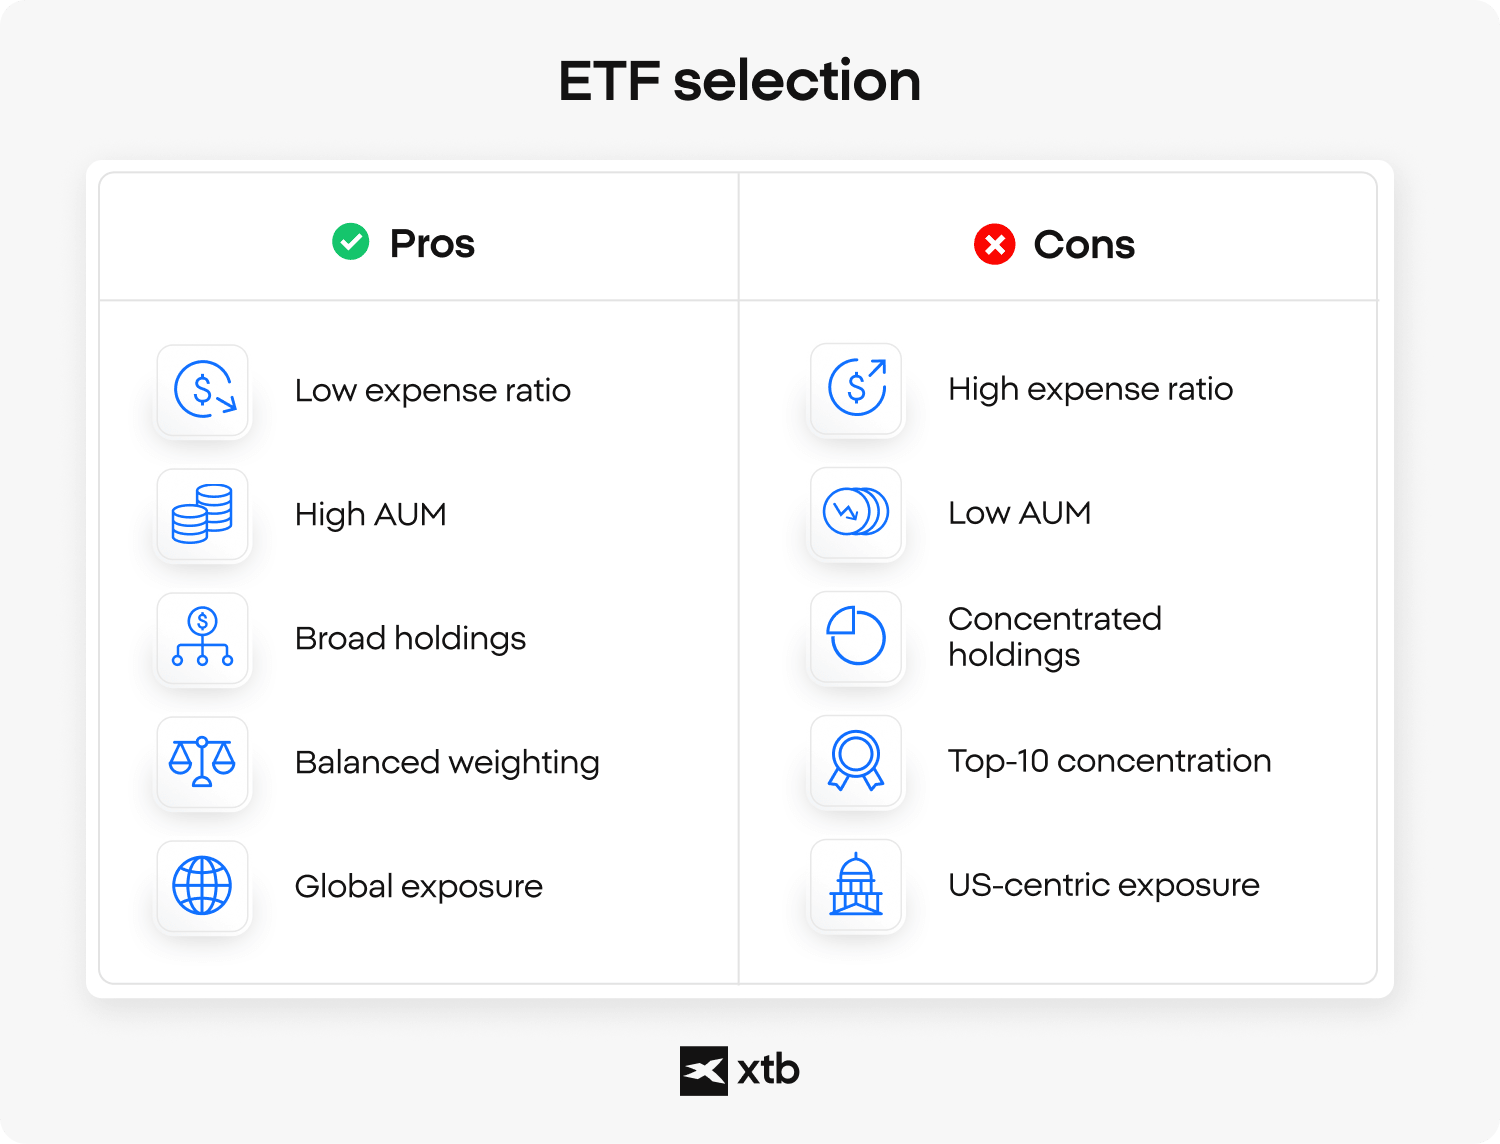
- Expense ratio (TER): Lower fees reduce the long-term cost of holding the fund.
- Number of holdings: A larger portfolio may offer broader diversification across the semiconductor industry.
- Top 10 concentration: Check how much of the ETF is concentrated in its largest positions, as high concentration can increase single-stock risk.
- Index methodology: Review whether the ETF tracks a broad semiconductor index, an ESG-filtered benchmark or a narrower AI-focused theme.
- AUM and liquidity: Larger funds with higher trading volumes may offer tighter spreads and easier execution.
Evaluating how to invest in ETFs requires market participants to open a licensed brokerage platform capable of routing orders to major global exchanges. Most major financial providers offer access to a wide variety of chip ETFs, from broad cap-weighted index funds to specialized thematic AI portfolios. Investors must align their chosen fund structure with their personal financial goals and timeline.
FAQ
A semiconductor ETF is an exchange-traded fund that provides exposure to a basket of companies involved in the semiconductor industry. Depending on the benchmark, this can include chip designers, foundries, memory manufacturers, and semiconductor equipment suppliers.
For investors, the main advantage is diversification within one sector. Instead of selecting a single company such as Nvidia, Micron or TSMC, a semiconductor ETF spreads exposure across several businesses with different positions in the chip supply chain.
The most useful starting point is the structure of the fund rather than its recent return. Investors should compare the cost, benchmark methodology, concentration, and geographical exposure because two semiconductor ETFs can hold many of the same companies but behave very differently.
The most important factors include:
expense ratio (TER)
assets under management (AUM)
top-10 concentration
weighting methodology
geographical and subsector exposure
A fund with hundreds of index constituents can still be highly concentrated if a small group of mega-cap companies accounts for most of the portfolio.
Semiconductor ETFs can offer relatively direct exposure to the infrastructure behind artificial intelligence. AI systems require GPUs, accelerators, HBM, server memory, networking chips, foundry capacity, and highly advanced manufacturing equipment.
This means AI exposure is not limited to chip designers. Memory companies, foundries, and equipment manufacturers can also benefit from rising investment in data centres and accelerated computing.
At the same time, semiconductor ETFs are not pure AI funds. Their performance can still depend on smartphones, PCs, automotive demand, industrial electronics, and the broader semiconductor cycle.
Semiconductors combine strong long-term growth potential with a historically cyclical business model. New fabrication capacity is extremely expensive and takes years to build, while demand can change much faster.
When demand exceeds supply, chip prices, margins, and earnings can rise sharply. But once too much capacity comes online or customers begin reducing inventories, pricing can deteriorate quickly. This boom-and-bust pattern is one of the main reasons semiconductor stocks can move much more aggressively than broad equity indices.
AI may make parts of the cycle more structural, especially in HBM and advanced computing, but it does not eliminate the risk of overinvestment and future oversupply.
A US-focused fund tends to concentrate more heavily on American chip designers and equipment companies, while a global semiconductor ETF can also include major Asian and European businesses.
That matters because the semiconductor supply chain is globally fragmented. TSMC dominates advanced foundry manufacturing, SK Hynix is important in memory and HBM, while ASML plays a critical role in lithography equipment.
A global fund can therefore provide broader exposure to the physical semiconductor supply chain, although this does not necessarily mean lower concentration risk.
Concentration risk appears when a relatively small number of companies account for a large share of an ETF. This is particularly important in semiconductors because the industry's market capitalization is dominated by a limited group of very large companies.
A semiconductor ETF may hold dozens or even hundreds of stocks, but its daily performance can still be heavily influenced by Nvidia, Broadcom, TSMC, AMD, or other major constituents.
Investors should therefore look beyond the total number of holdings and check how much of the fund is concentrated in its largest positions.
A cap-weighted ETF gives larger companies a greater portfolio weight. As a result, successful mega-cap businesses can dominate performance, which can be attractive during strong AI-led rallies but also increases dependence on a few names.
An equal-weight strategy distributes capital more evenly across constituents. This reduces reliance on the largest companies but gives smaller and often more volatile semiconductor stocks a much greater influence.
Neither methodology is automatically better. The choice changes where the risk sits.
Higher bond yields can pressure semiconductor ETFs even when industry demand remains strong. Many chip companies trade on expectations of substantial future earnings growth, so higher discount rates can reduce the valuation investors are willing to pay for those earnings.
There is also a second effect. Semiconductor fabs, AI data centres, electricity infrastructure and advanced packaging facilities require huge amounts of capital, so higher borrowing costs can eventually slow the pace of investment.
The main transmission channels are:
lower equity valuation multiples
higher financing costs for fabs and data centres
potentially slower hyperscaler capital expenditure
greater pressure on highly valued growth stocks
This is why semiconductor stocks can fall even while revenue forecasts remain relatively strong
The global semiconductor industry is unusually exposed to geopolitical risk because advanced production is concentrated in a small number of locations.
Taiwan is particularly important because of TSMC's position in advanced foundry manufacturing. At the same time, US-China technology restrictions can affect access to advanced chips, semiconductor equipment, and key end markets.
A semiconductor ETF can diversify company-specific risk, but it cannot fully diversify away from geopolitical shocks affecting the entire supply chain.
The sector can offer strong structural growth, but it also carries several risks that tend to appear at the same time during downturns.
The key risks include:
semiconductor oversupply and inventory corrections
high concentration in a few mega-cap companies
rising interest rates and bond yields
geopolitical tension and supply-chain disruption
weaker AI or data-centre capital expenditure
expensive valuations after strong sector rallies
These risks are especially important because semiconductor earnings can change quickly when pricing, utilization rates, or end-market demand deteriorate.
They can reduce single-company risk, but they do not provide the same type of exposure. Buying an individual semiconductor stock means taking a concentrated view on one company's technology, management, customers, and competitive position.
An ETF spreads that exposure across multiple companies. That can reduce the damage caused by one disappointing earnings report, but it can also dilute the upside from a single outperforming company.
For sector analysis, semiconductor ETFs can also work as useful benchmarks for comparing whether an individual chip stock is outperforming or underperforming the broader industry.
They can be used for long-term sector exposure, but they remain much more concentrated than broad equity ETFs. Their performance depends heavily on the semiconductor cycle, valuations, and technological changes.
Long-term investors should therefore distinguish between standard physically replicated semiconductor ETFs and leveraged products. Leveraged ETFs are designed around daily return targets and can behave very differently over longer periods because of compounding and volatility drag.