
This article provides a practical guide to reading financial statements to assess a company’s profitability, financial health, and the reliability of its profits before investing.
This article provides a practical guide to reading financial statements to assess a company’s profitability, financial health, and the reliability of its profits before investing.


Key Takeaways
- Reading financial statements requires answering three specific questions about a company, rather than memorising document structures.
- The three main financial statements each answer a distinct question regarding profitability, health, and cash generation.
- Accounting profit does not equal cash in the bank, which is why investors evaluate all documents together.
- The notes to financial statements act as an instruction manual; ignoring them makes the numbers misleading.
How to read financial statements: where do you start and in what order?
To effectively evaluate a company, you start reading financial statements with the income statement to see if it makes money, proceed to the balance sheet to check financial health, and finish with the cash flow statement to verify if the profit equals real cash.
Answering these three questions builds a complete map of the business's operations. Going from the question of profitability to verifying the actual cash generation ensures that the reported earnings are backed by tangible funds. You must read the notes to the financial statements concurrently with these 3 core documents.
The notes provide the necessary context to understand how the company calculated its numbers. Without this parallel reading, learning how to read financial statements becomes an exercise in guessing, as the notes contain critical accounting policies and explanations for specific line items.
|
|
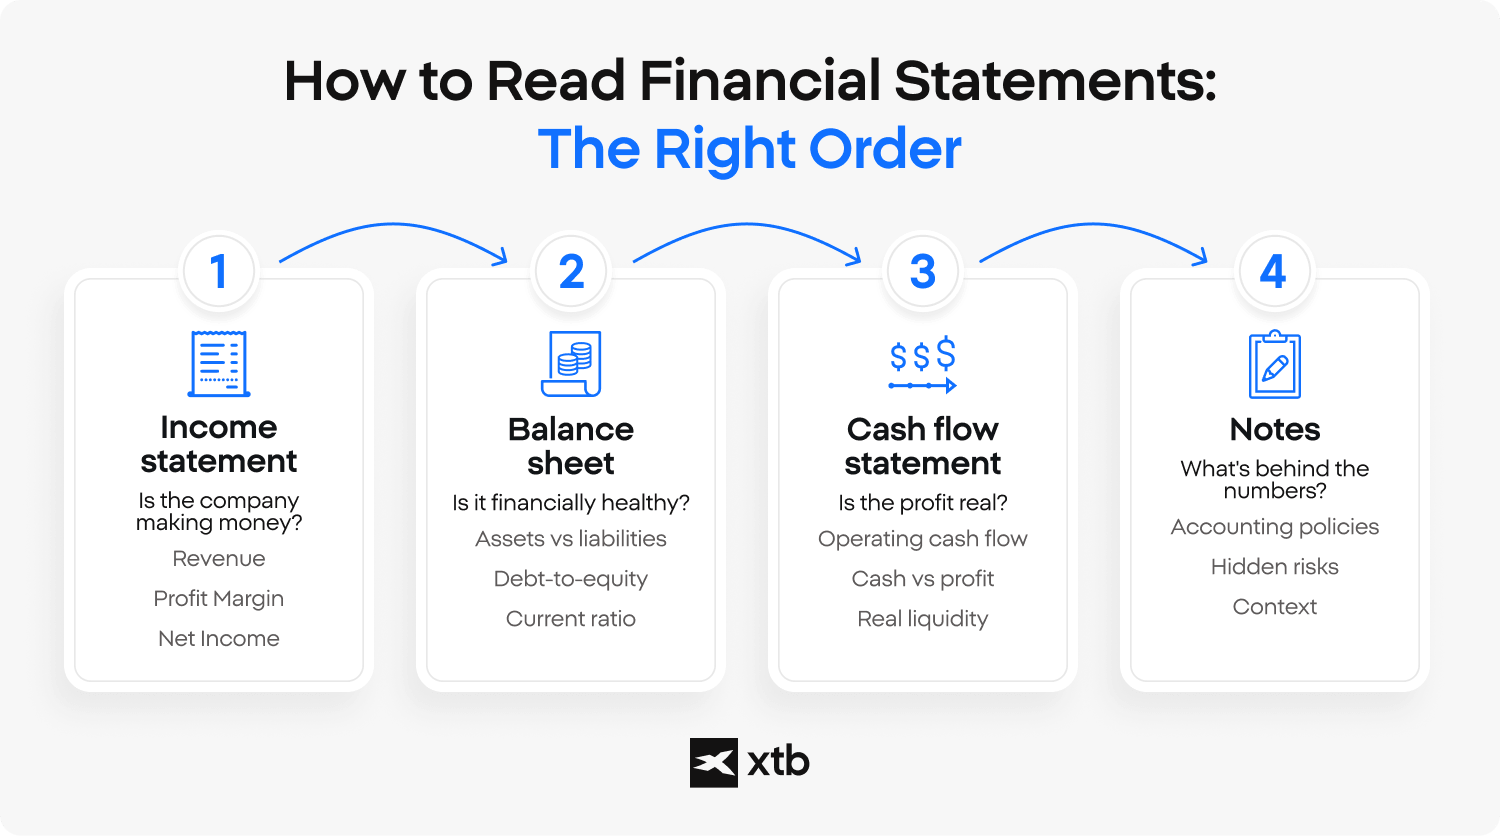
1-Is the company making money? (reading the income statement)
To assess whether a business generates earnings, you read the income statement by examining the revenue trend, profit margin, and net income over multiple periods rather than a single quarter.
Evaluating a single reporting period often misleads investors due to seasonal fluctuations or one-off events. Instead, analyzing year-over-year revenue growth reveals whether core operations are expanding. You isolate the recurring operating profit from any non-recurring items to determine true profitability.
The income statement summarises a company's revenues and expenses over a specific timeframe. This document directly shows the net income, indicating what is left after all costs are subtracted. Monitoring these figures helps determine if the company's business model is viable in the long term.
2- Is it financially healthy? (reading the balance sheet)
To evaluate a company's financial condition, you read the balance sheet by comparing the relationship between assets and liabilities, calculating the debt to equity ratio, and reviewing the shareholders' equity.
A healthy business keeps debt in proportion to equity and holds enough liquid assets to cover its short-term obligations. Two ratios you calculate directly from the balance sheet make this measurable:
- Debt-to-equity ratio = total liabilities / shareholders' equity. A reading below 1.0 signals conservative financing, while a value above 2.0 often points to elevated leverage and higher financial risk. Acceptable levels vary by industry, so capital-heavy sectors like utilities naturally run higher than software companies.
- Current ratio = current assets / current liabilities. A value above 1.0 means the company can cover its short-term liabilities with short-term assets; below 1.0 flags potential liquidity strain. Many investors look for a current ratio between 1.5 and 3.0 as a comfortable buffer.
Analyzing the structure of the assets then confirms the company holds resources that generate future value rather than idle or overvalued items.
The balance sheet provides a snapshot of what the company owns and owes at a specific point in time. Checking the shareholders' equity reveals the net worth belonging to the owners. If you want to dive deeper into these mechanics, exploring how to read a balance sheet provides more granular insights.
3-Is the profit real? (reading cash flow and connecting the three)
To verify if reported profit represents actual money, you analyse the cash flow statement by checking for positive operating cash flow, and then connect all three statements because accounting profit does not equal cash.
Understanding how to read financial statements requires linking the net income to the equity on the balance sheet and finally reconciling it through the cash flow statement. You must track where the cash originates, distinguishing between funds generated from daily operations and money raised through external financing. Positive operating cash flow confirms that the core business generates tangible funds.
The notes to financial statements serve as the instruction manual for finding hidden risks. You look into the notes to uncover aggressive accounting policies, off-balance-sheet items, and one-off adjustments. This step is crucial for tying the statementback to the overall cash position.
|
|
4- How do you interpret financial statements in context?
To interpret financial statements effectively, you must compare results across multiple reporting periods and against industry peers to distinguish temporary fluctuations from long-term trends. This approach helps distinguish temporary fluctuations from long-term trends while providing a clearer picture of profitability, financial stability, and operating performance.
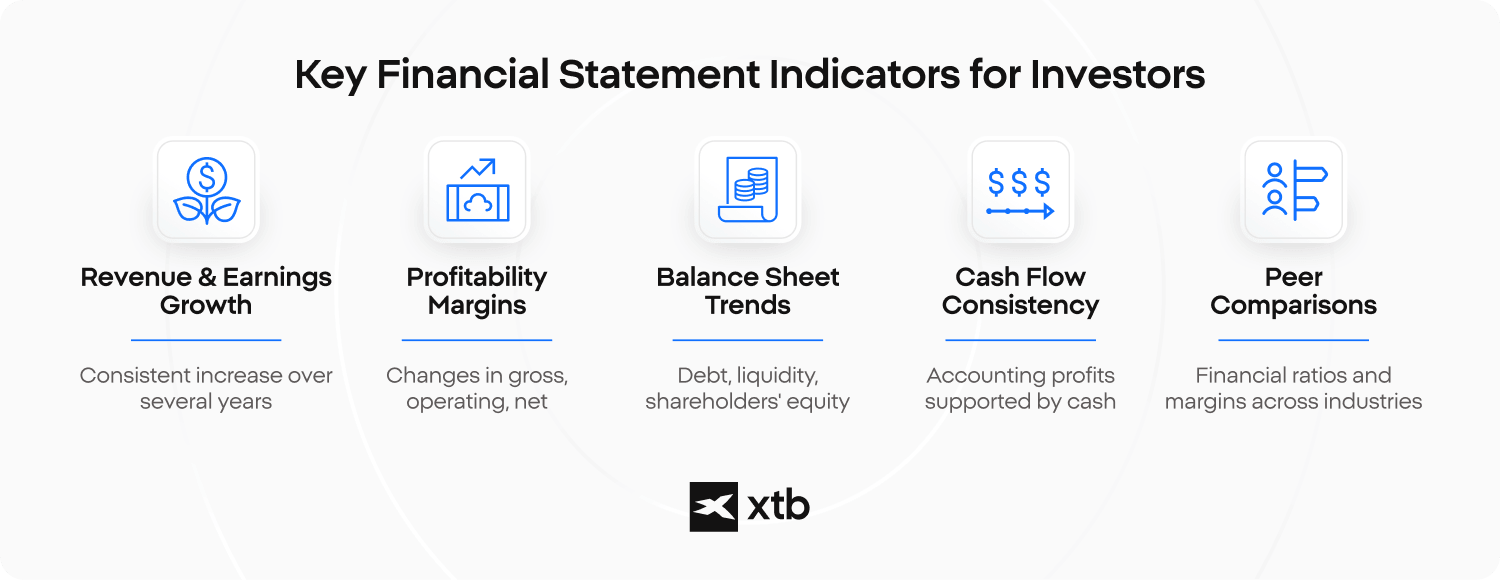
When interpreting financial statements, investors typically look for:
- Consistent revenue and earnings growth over several years rather than one exceptional quarter.
- Changes in profitability by comparing gross, operating, and net margins over time.
- Balance sheet trends, including debt levels, liquidity, and shareholders' equity.
- Cash flow consistency, confirming that accounting profits are supported by cash generated from operations.
- Peer comparisons, since financial ratios and margins vary significantly across industries and business models.
Understanding financial statements in this broader context reduces the risk of drawing conclusions from temporary events or isolated accounting figures. AI tools can speed up reading financial statements by extracting figures and flagging trends, but they cannot replace judgement. The notes, accounting policies, and offbalance-sheet items still require human review, and no automated summary should be the sole basis for an investment decision.
Why do successful investors focus on financial statements?
Financial statements have long been the foundation of fundamental investing because they allow investors to evaluate a company's economic reality rather than its market narrative. Many of the world's best-known investors—including Warren Buffett, Howard Marks, Joel Greenblatt, Peter Lynch, Benjamin Graham, and Stanley Druckenmiller—have repeatedly emphasised that understanding a business begins with understanding its financial statements, even if they ultimately apply different investment philosophies.
Value investors such as Benjamin Graham and Warren Buffett have historically focused on consistent profitability, conservative balance sheets, and strong cash generation when selecting businesses. Joel Greenblatt's investment approach combines profitability with capital efficiency, while Howard Marks frequently highlights the importance of assessing financial risk and balance-sheet strength before considering potential returns. Although Stanley Druckenmiller is best known as a macro investor, he has often stressed that strong earnings growth, improving cash flows, and changing fundamentals are key drivers of long-term stock performance.
History provides numerous examples of why reading financial statements matters:
- Enron (2001): complex disclosures and off-balance-sheet liabilities highlighted the importance of reading the notes—not just the headline financial figures.
- Lehman Brothers (2008): increasing leverage and deteriorating balance-sheet quality became visible before the company's collapse, illustrating why debt analysis is essential.
- Apple: years of growing operating cash flow and expanding profitability reflected the company's strengthening competitive position long before it became one of the world's largest businesses by market capitalisation.
- NVIDIA: accelerating revenue growth, expanding margins, and exceptional operating cash flow during the AI boom demonstrated how improving financial statements can support a rapidly rising market valuation.
These examples highlight an important principle: financial statements rarely predict the future, but they provide objective evidence of how a business is evolving. Rather than relying on headlines or short-term market sentiment, experienced investors combine financial statement analysis with an assessment of competitive advantages, management quality, valuation, and industry trends before making investment decisions.
Financial statements alone rarely determine whether a stock is a good investment. As Howard Marks often emphasizes, investing is not only about what you buy, but also what price you pay. Professional investors typically use financial statements as a starting point for deeper analysis, combining historical performance with qualitative factors such as competitive positioning, capital allocation, corporate governance, and future growth prospects.
What red flags should you watch for?
When reading financial statements, investors watch for red flags such as accounting profit without cash, escalating debt, and one-time events that inflate earnings, while avoiding the mistake of analysing one document in isolation.
Relying on a single document or a single reporting period creates a distorted view of the company. A classic warning sign is a positive net income paired with a negative operating cash flow, which indicates potential cash collection issues. You should also scrutinise the notes for aggressive accounting policies that might temporarily boost profitability.
Conducting thorough fundamental analysis means recognising these warning signs before allocating capital. You can integrate these insights into valuation models, such as discounted cash flow, to determine a company's true worth. Ultimately, learning how to read financial statements requires a comprehensive approach to all available data.
|
|

FAQ
FAQ
Most investors begin with the income statement to evaluate profitability, then review the balance sheet to assess financial strength, and finish with the cash flow statement to confirm whether reported earnings are supported by real cash generation. Reading the statements in this sequence helps build a complete picture of a company's financial performance.
There is no single most important financial statement. The income statement explains profitability, the balance sheet reveals financial stability, and the cash flow statement measures liquidity. Investors typically analyse all three together because each answers a different question about the business.
Net income is calculated using accrual accounting, meaning revenue and expenses can be recognised before cash changes hands. The cash flow statement adjusts for these accounting differences, showing how much cash actually entered or left the business during the reporting period.
Looking at several reporting periods is generally more informative than reviewing a single quarter or year. Comparing financial statements over time helps identify long-term trends in revenue, profitability, debt, and cash generation while reducing the impact of temporary events.
Beginners should focus on a few key indicators: whether revenue is growing, whether the company consistently earns a profit, whether debt remains manageable, and whether operating cash flow is positive. These fundamentals provide a solid starting point before analysing more advanced financial ratios.
The notes explain how the reported figures were prepared and provide additional disclosures that may not appear directly in the main statements. They often include information about accounting policies, debt obligations, legal proceedings, significant risks, and unusual transactions that can influence how investors interpret the numbers.
Public companies typically publish financial statements in the Investor Relations section of their websites. They are also available through regulatory filing systems, such as the SEC's EDGAR database in the United States, as well as on many stock exchange websites and financial data platforms
Common red flags include declining operating cash flow despite rising profits, rapidly increasing debt, shrinking profit margins, recurring one-time gains that boost earnings, and significant changes in accounting policies. These issues deserve closer investigation before making an investment decision.
Financial statements are prepared according to established accounting standards, but they still require careful interpretation. Temporary events, accounting estimates, and unusual transactions can affect reported results, which is why investors should analyse multiple reporting periods and review the accompanying disclosures.
Professional investors rarely rely on a single metric. They compare financial statements over several years, benchmark results against competitors, evaluate key financial ratios, and verify that reported earnings are supported by sustainable operating cash flow before assessing a company's valuation.