


Apple (AAPL.US) closed the fourth quarter of fiscal 2026 with better-than-expected net income of $30.71 billion and revenue of $114.5 billion, representing 12% year-over-year growth and a result comfortably above analysts' expectations. The iPhone remained the main growth driver, with sales rising 17% year-over-year and exceeding market forecasts, while Mac revenue recorded an even stronger 24% increase.
Apple maintained high profitability and generated $30.71 billion in net income despite rising component costs and supply chain pressures. The report highlights the strength of Apple's business and demand for its devices and services, although weaker-than-expected revenue in China and declining sales of iPads and wearables point to uneven growth across product categories. Apple shares were virtually unchanged following the earnings release, trading near their regular-session closing price of $338.50 in after-hours trading.
Apple's key financial results for Q4 FY2026
-
Revenue increased 12% year-over-year to $114.50 billion, compared with the consensus estimate of $113.39 billion. This represents a beat of approximately $1.1 billion, or nearly 1%, and marks a new September-quarter revenue record. For a company operating at Apple's scale, double-digit revenue growth remains an important sign of resilient demand for its products and services.
-
Earnings per share (EPS) reached $2.10, compared with expectations of $1.99, beating estimates by approximately 5.5%. However, the result included a positive impact from tariff-related reimbursements, estimated at $0.05 per share. Excluding this effect, EPS would have been approximately $2.05, still above consensus but indicating that part of the earnings surprise did not come directly from operating performance.
-
Net income increased 12% year-over-year to $30.71 billion, corresponding to a net profit margin of approximately 26.8%. This means Apple generated nearly 27 cents in net profit for every dollar of revenue. Such high profitability remains one of the company's most important business strengths, although future results remain sensitive to production costs, pricing changes and the sales mix.
-
Gross margin reached 47.9%, exceeding the consensus estimate of 47.5%. Gross profit increased 13% year-over-year to $54.82 billion. Tariff-related reimbursements improved the reported margin by approximately 1 percentage point, suggesting that without this factor, gross margin would have been closer to 46.9%. This distinction matters when assessing the sustainability of profitability in the coming quarters.
-
Operating income increased 10% year-over-year to $35.63 billion, compared with analysts' expectations of $34.52 billion. This translates into an operating margin of approximately 31.1%, confirming Apple's ability to generate substantial profits while maintaining a massive revenue base.
iPhone and Mac drive the strongest revenue growth
-
iPhone revenue increased 17% year-over-year to $57.58 billion, compared with expectations of $56.48 billion. This means smartphones accounted for approximately half of Apple's quarterly revenue and remain by far its most important product category. Strong sales of the latest generation of devices highlight the importance of customer loyalty and the company's ability to maintain robust demand despite increasing competition.
-
Services revenue reached a record $31.57 billion, growing approximately 10% year-over-year and coming in virtually in line with analysts' expectations of $31.58 billion. Services accounted for approximately 27.6% of total revenue, providing an important source of recurring sales. Growth in this segment increases the value of Apple's installed device base and reduces the company's dependence on cyclical hardware launches.
-
Mac revenue jumped 24% year-over-year to $10.79 billion, significantly exceeding the consensus estimate of $9.69 billion. This was the strongest growth rate among Apple's major product categories. The result suggests sustained demand for the company's computers and an improving contribution to overall ecosystem revenue.
-
iPad revenue declined 10% year-over-year to $6.23 billion, compared with analysts' expectations of $6.83 billion. This was one of the more notable disappointments in the report, pointing to weaker demand in the tablet category. However, the decline may also reflect differences in product launch schedules and replacement cycles, meaning that a single quarter does not necessarily determine the longer-term trend.
-
Wearables, Home and Accessories revenue fell 8% year-over-year to $8.30 billion, compared with expectations of $8.99 billion. Weaker sales of smartwatches, headphones and other accessories provide another indication that consumer demand is not growing evenly across product categories. Looking ahead, the key question is whether new generations of devices will be sufficient to reverse this trend.
Total product revenue reached $82.9 billion, increasing 12% year-over-year and exceeding the consensus estimate of $81.46 billion. The result confirms that hardware remains Apple's primary revenue driver, despite the growing importance of Services, which narrowly missed Wall Street expectations.
China grows rapidly but falls short of analysts' expectations
Greater China revenue increased 21% year-over-year to $17.54 billion but fell short of the consensus estimate of $18.55 billion. Although the region recorded the strongest growth rate among Apple's major geographic markets, the shortfall against expectations exceeded $1 billion. This illustrates just how much analysts have been expecting from the recovery in Chinese sales, where domestic competition and product availability remain important factors. According to the Financial Times, Apple's management also pointed to supply constraints that limited the company's ability to meet demand.
The Americas remained Apple's largest market, generating $48.68 billion in revenue, up 10% year-over-year. The region accounted for approximately 42.5% of total revenue, confirming its central importance to the company's financial performance. European revenue increased 12% year-over-year to $32.01 billion, representing approximately 28% of Apple's sales. Double-digit growth in the company's second-largest geographic region supports the broader picture of solid demand for its products and services. The Rest of Asia Pacific generated $9.71 billion in revenue, up 15% from a year earlier, while Japan recorded a modest 1% decline to $6.54 billion. These results highlight the uneven performance of Asian markets, where growth in some countries offsets weaker sales elsewhere.
Cash flow and shareholder returns
Apple generated approximately $145.1 billion in operating cash flow during fiscal 2026. This is one of the company's most important financial metrics, demonstrating its substantial ability to finance investments, research and development, and shareholder distributions through cash generated by its core operations. In the fourth quarter alone, operating cash flow reached approximately $28 billion, while the company returned a similar amount to shareholders through dividends and share repurchases. The scale of these capital distributions remains an important feature of Apple as a mature technology company, although it does not eliminate the risk of declines in its share price.
Apple maintained its quarterly dividend at $0.27 per share. However, share repurchase programs play a much larger role in the company's total shareholder distributions, as they can reduce the number of shares outstanding and support EPS growth. Management also reported that Apple's installed base of active devices reached a new all-time high across all major product categories and geographic regions. This is particularly important for the long-term outlook of the Services segment, as a larger user base creates opportunities to generate additional revenue from subscriptions, payments and other digital services.
Apple's R&D spending is growing much faster than revenue
Apple's research and development (R&D) expenses increased 32% year-over-year to $11.73 billion in the fourth quarter, exceeding analysts' expectations of $11.63 billion. This means the company allocated more than 10% of quarterly revenue to R&D, compared with approximately 8.7% a year earlier. Total operating expenses rose 21% year-over-year to $19.19 billion, significantly outpacing revenue growth. Meanwhile, selling, general and administrative (SG&A) expenses increased by just 5.8% year-over-year to $7.46 billion, indicating that technology development spending was the main contributor to rising operating costs.
Higher R&D spending may reflect intensified development efforts in artificial intelligence, software and new device categories, but it also raises expectations regarding the future monetization of these projects. Research and development expenses now account for more than 61% of Apple's total operating expenses. From an investor's perspective, the key question is whether this acceleration in spending will translate into new revenue streams and stronger competitiveness in the coming years, or primarily result in a permanently higher cost base.
iPhone Duo and the holiday quarter: A major test of demand for Apple?
Analysts' consensus forecasts suggest that Apple's revenue could reach approximately $153 billion in the first quarter of fiscal 2027, covering the holiday shopping season, with nearly $89 billion expected to come from iPhone sales. The launch of the iPhone Duo, Apple's first foldable smartphone, will be particularly important, as the device only went on sale in October and therefore had no impact on the recently reported quarter. According to Bloomberg Intelligence, demand for the device could translate into sales of 14 million to 16 million units during its first 12 months, compared with an earlier forecast of 10 million to 14 million. These figures represent analysts' projections rather than official company guidance.
The biggest uncertainty remains Apple's ability to meet demand, as limited iPhone Duo availability could push some revenue beyond the crucial holiday shopping season. According to industry reports, delivery dates for some orders extend into late January 2027, suggesting that strong consumer interest in the new model may not immediately translate into reported sales. Another challenge comes from the revised product launch schedule, including the absence of a standard iPhone 18 in the autumn lineup and the later introduction of certain new devices. For new CEO John Ternus, who took over in September, the coming months will therefore represent his first major test of managing supply, product launches and Wall Street expectations.
What do Apple's results mean for investors?
The report confirms that despite its enormous scale, Apple remains capable of delivering double-digit revenue and earnings growth without taking on the same level of AI infrastructure investment risk as the largest data center operators. The company primarily benefits from the strength of its ecosystem, its expanding installed user base and opportunities to sell additional services to existing customers. The combination of growing iPhone and Mac sales alongside record Services revenue is particularly encouraging.
Revenue, earnings and free cash flow are all rising, but so are R&D expenses, while gross margin has edged lower and the value of share repurchases has declined. Investors have reasons to be concerned about this combination. Even Apple's exceptionally strong market position does not guarantee consistent growth across all products and geographic regions. Weakness in iPads and wearables, disappointment over the pace of expansion in China and the partly one-off impact of tariff-related reimbursements on margins remain important considerations when assessing the quality of the earnings report. For investors, the main focus now shifts to the outlook for the holiday quarter, component costs, product availability and the company's ability to sustain its expansion.
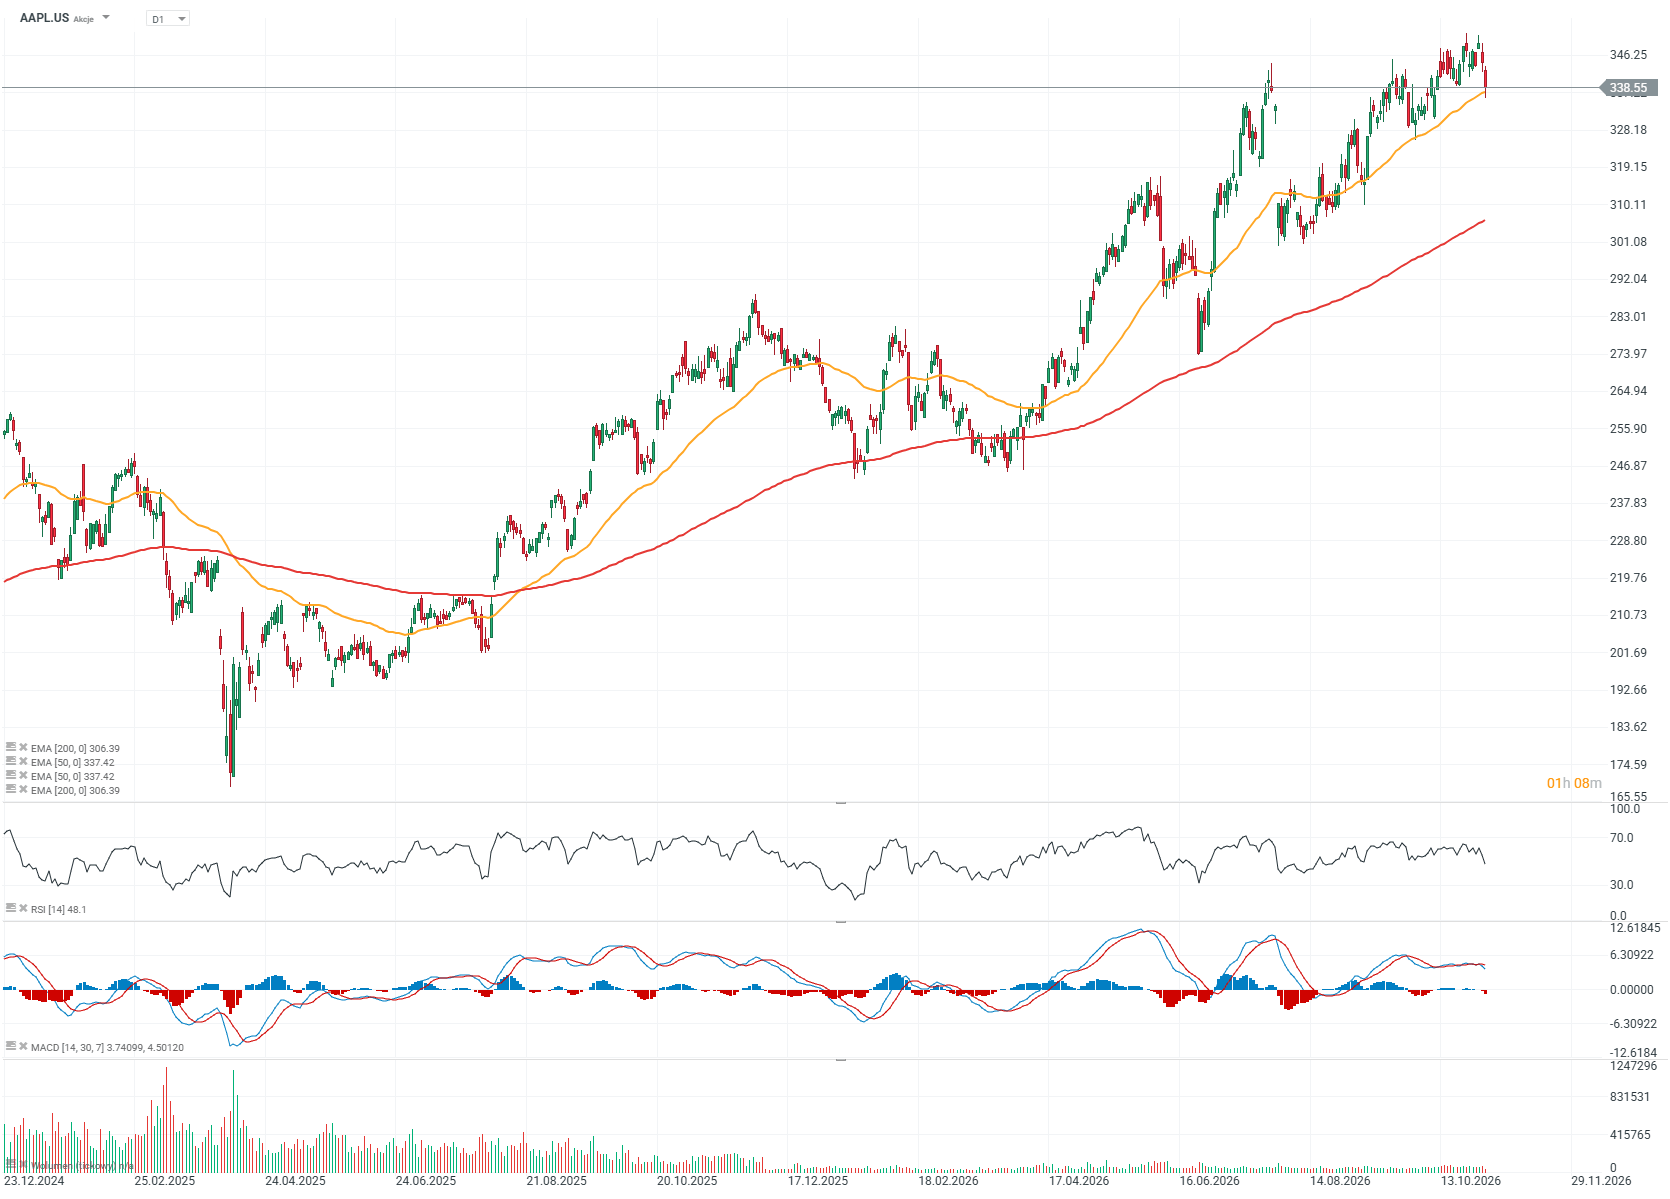
Apple (AAPL.US) share price chart, D1 timeframe
Apple shares have nearly doubled in value from their April 2025 levels, when trade tensions escalated, and have proven remarkably resilient to turbulence across the technology sector during the second half of this year. Recently, the stock reached fresh all-time highs even as the Nasdaq declined, but strong selling pressure emerged ahead of the earnings report, pushing the price toward the 50-session exponential moving average (EMA50, orange line). The $350 area, corresponding to recent highs, remains an important resistance level, while support is located around $335 per share. A break below this support could signal a meaningful risk of a deeper correction, potentially toward the $300 level.
Source: xStation5
Apple's valuation and business growth charts (as of the November 2, 2026 trading session)
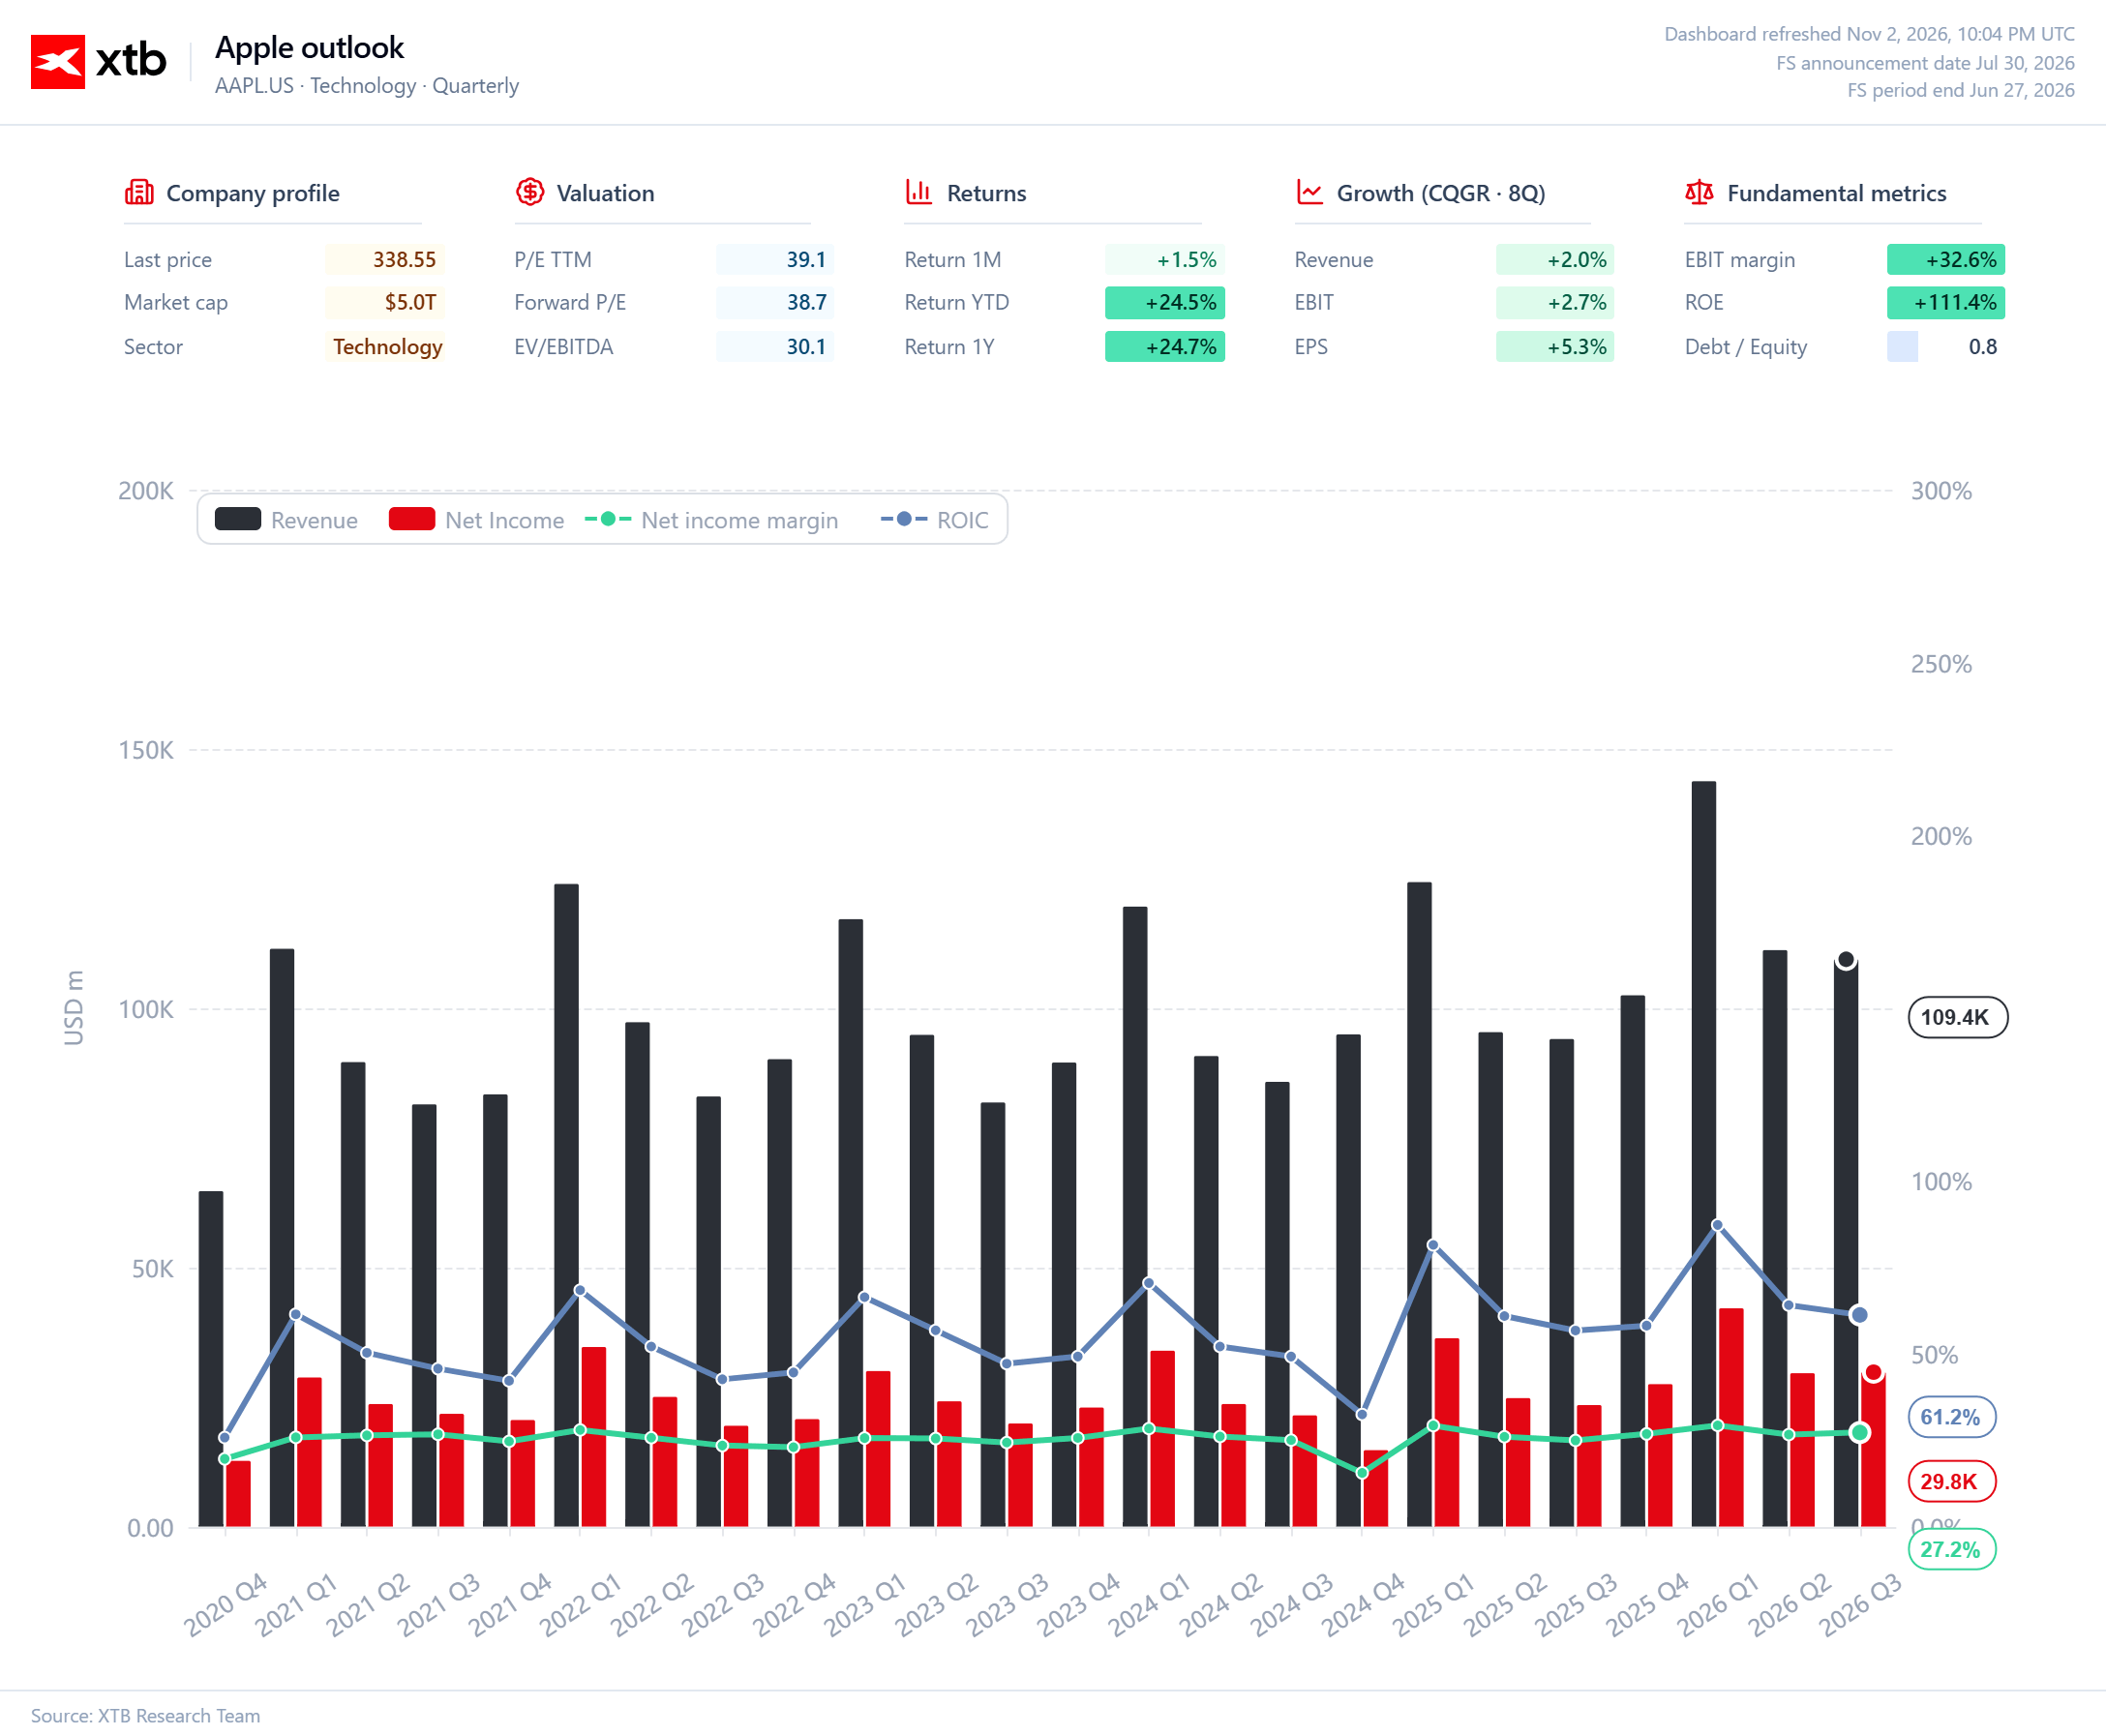
Chart 1. Revenue, net income and return on invested capital
Apple's long-term financial performance shows that the company has managed not only to expand its revenue base but also to retain an increasing share of sales as net profit, with its net profit margin rising from approximately 20% in late 2020 to 27.2% in the third quarter of fiscal 2026. With quarterly revenue of $109.4 billion, the company generated $29.8 billion in net income, maintaining profitability levels more commonly associated with highly scalable digital businesses than traditional consumer electronics manufacturers. Particularly noteworthy is the return on invested capital (ROIC) of 61.2%, suggesting that Apple requires a relatively modest capital base to generate substantial operating profits. Such a high ROIC reflects, among other factors, the strength of Apple's brand, intellectual property and outsourced manufacturing model, although the reported figure also depends on the methodology used to calculate invested capital. From a valuation perspective, the key question is whether Apple can sustain this level of capital efficiency, as a P/E ratio close to 39 suggests that the market is already pricing in exceptional business quality, leaving limited room for disappointment.
Source: XTB Research
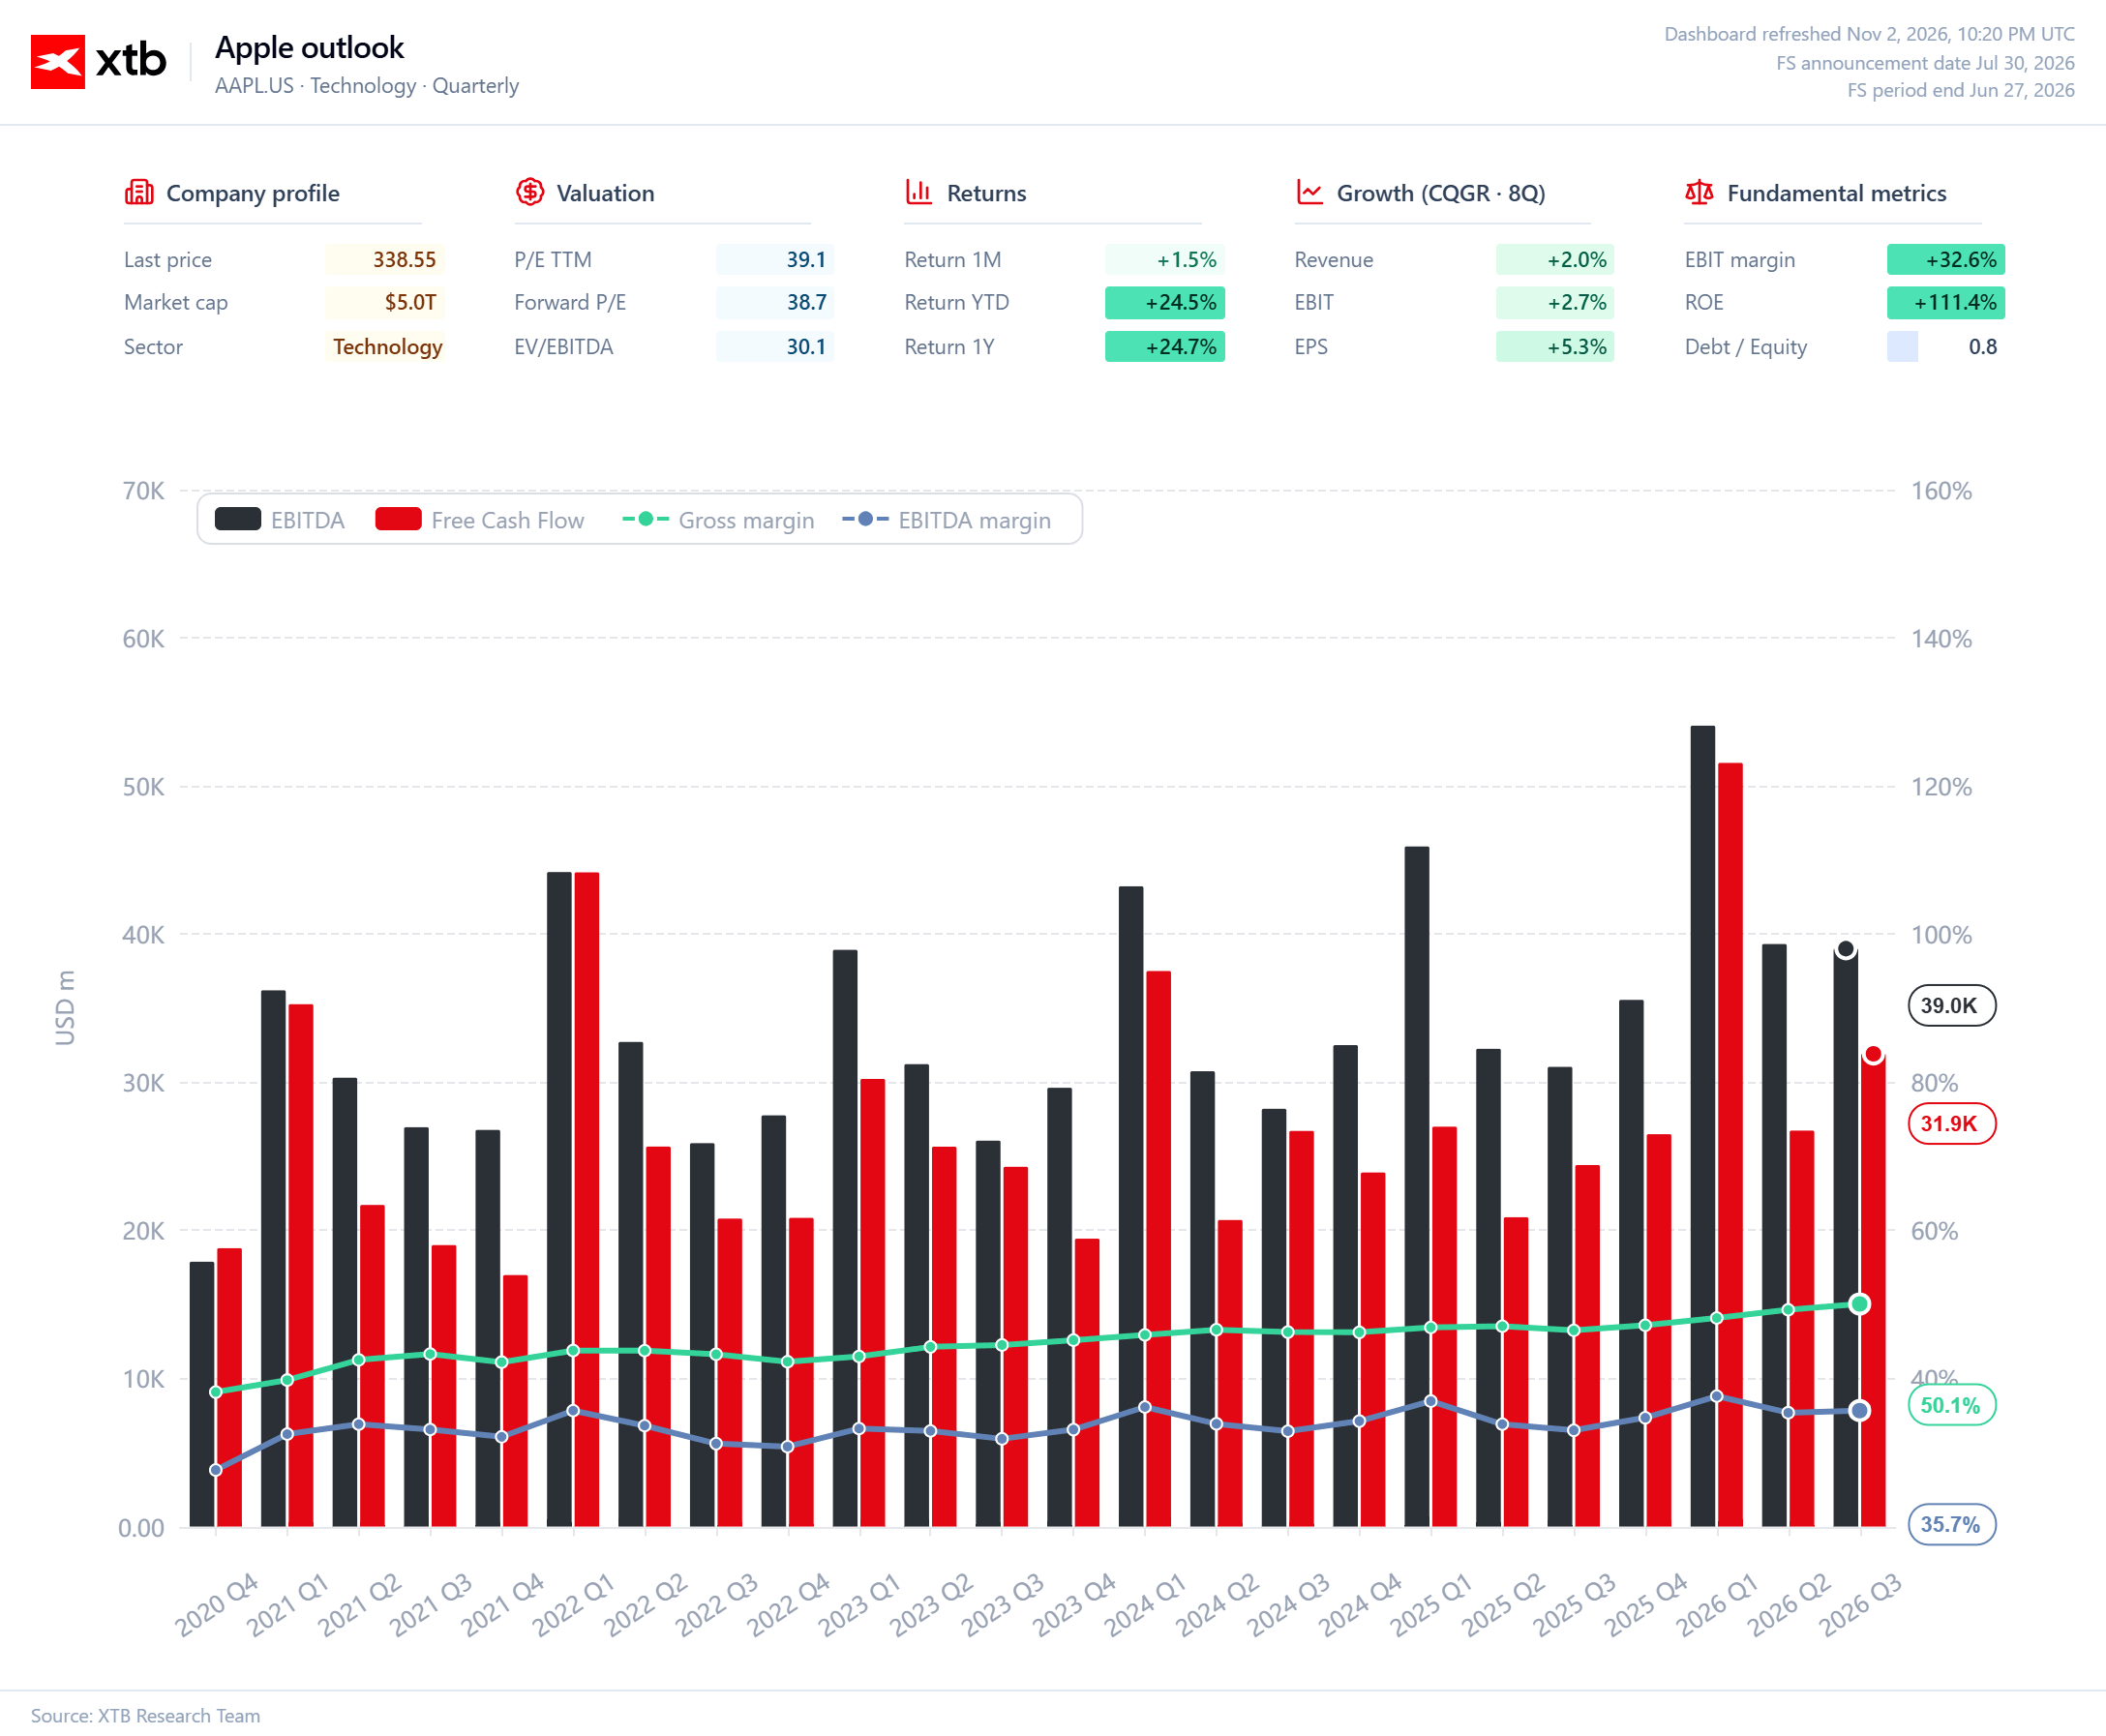
Chart 2. Apple's EBITDA and free cash flow
Over the past six years, Apple has steadily improved its gross margin, which increased from approximately 39% in late 2020 to 50.1% in the third quarter of fiscal 2026, reflecting the company's growing ability to generate profit from its products and services. EBITDA reached $39.0 billion, with an EBITDA margin of 35.7%, representing a gap of 14.4 percentage points relative to gross margin and highlighting the considerable impact of operating expenses, including research and development spending, on overall profitability. Interestingly, despite the long-term improvement in gross margin, EBITDA margin has remained relatively stable in recent years, suggesting that part of the benefits from a more favorable sales mix are being absorbed by rising operating costs. Free cash flow of $31.9 billion represented approximately 82% of quarterly EBITDA, confirming Apple's strong cash generation capabilities, although this relationship is subject to seasonal fluctuations driven partly by working capital movements. From an investor's perspective, the key issue is therefore not simply whether Apple can maintain gross margins near historical highs, but whether it can translate this competitive advantage into sustained EBITDA and FCF growth, particularly with the stock trading at approximately 39 times annual earnings.
Source: XTB Research
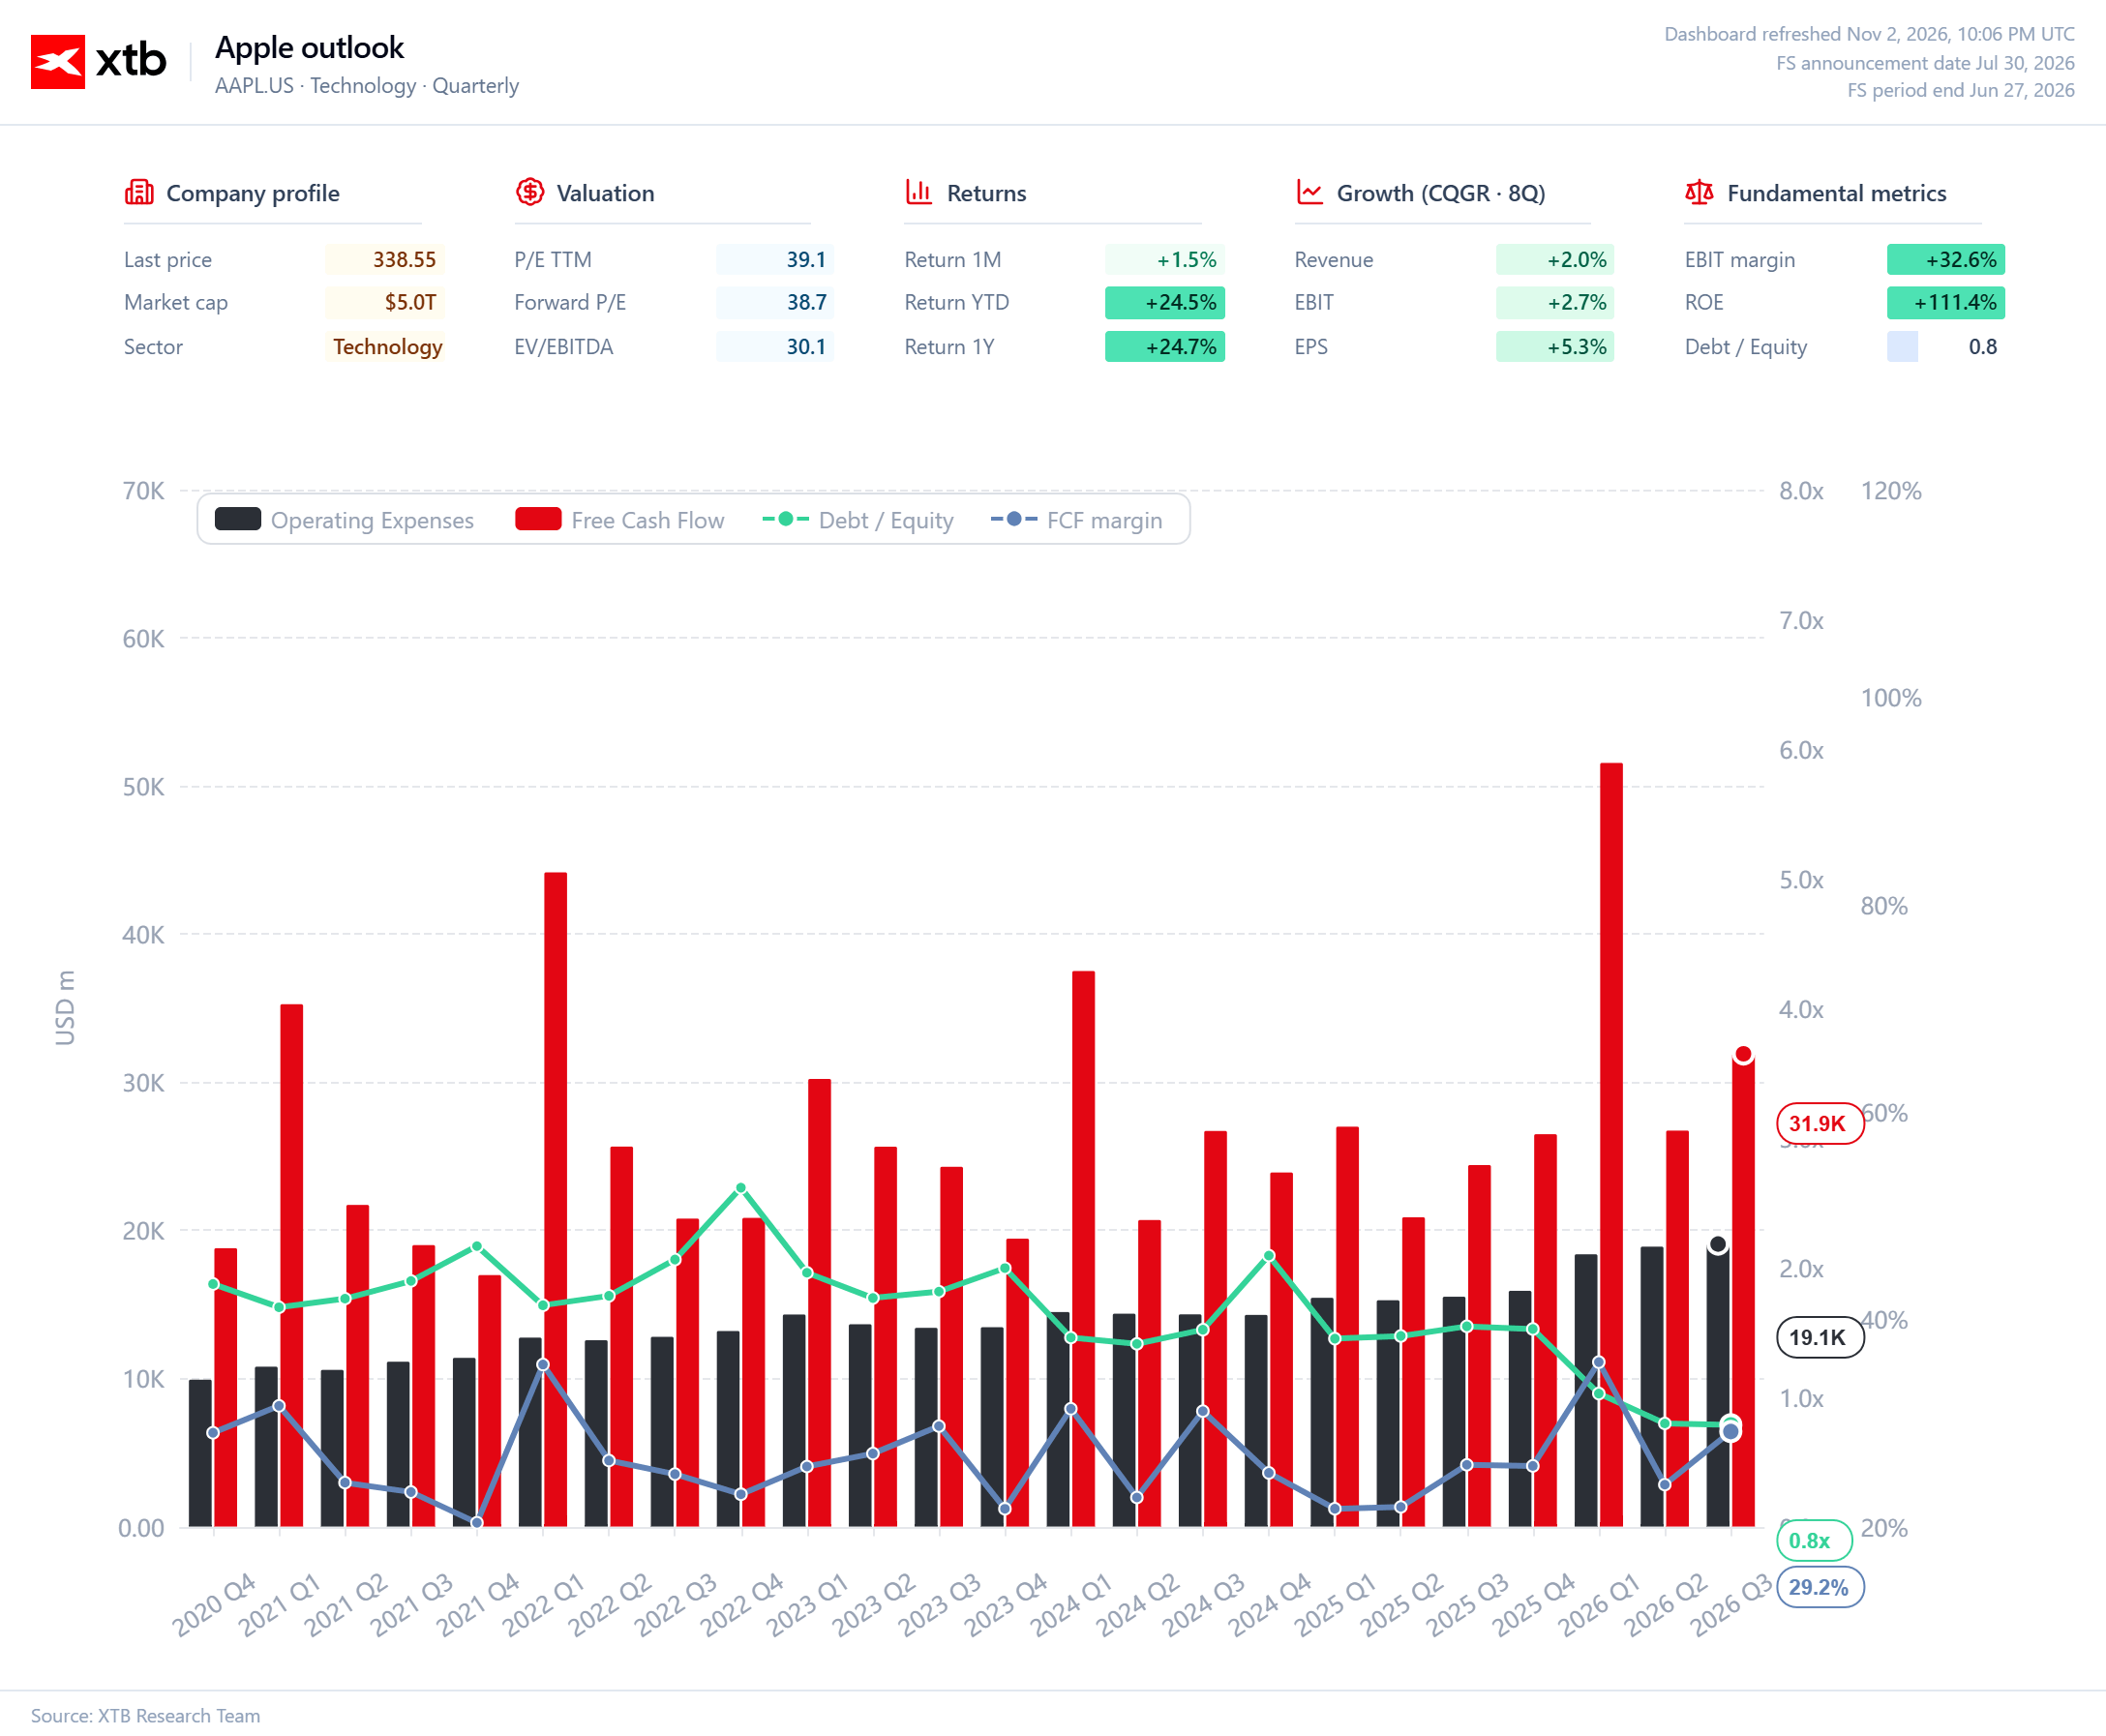
Chart 3. Apple's operating expenses, free cash flow and leverage
Apple's operating expenses increased from approximately $10 billion per quarter in late 2020 to $19.1 billion in the third quarter of fiscal 2026, although the expansion of its business was accompanied by an even stronger ability to generate cash. Free cash flow (FCF) reached $31.9 billion in the latest quarter shown, with an FCF margin of 29.2%, highlighting the exceptional cash-generating efficiency of Apple's business model. The seasonal fluctuations in FCF visible on the chart, particularly the sharp increases during holiday quarters, demonstrate why a single quarterly reading should not be considered representative of the full year. Particularly significant is the decline in the debt-to-equity ratio from levels above 2.0 in previous years to approximately 0.8, although the interpretation of this metric is complicated by the historical impact of share buybacks on the book value of shareholders' equity. The combination of strong cash generation and declining financial leverage reduces Apple's balance sheet risk, providing management with considerable flexibility to finance new projects without significantly increasing debt.
Source: XTB Research


Palantir Nearly Doubles Revenue 📈 Shares Edge Higher Following Strong Earnings



Daily Summary: A Rollercoaster Ride in the Commodities Market🚨Oil Drops 7%; Gold Rallies Over 2%💥


Alstom shares slump 25% in panic mode after the business guidance cut



US OPEN: Bloody end to the quarter. Intel loses nearly 1/3 of its value, and the crypto market shakes off a hack on the largest exchange.