


- In the derivatives market, leverage remains elevated but has stopped increasing. Futures open interest fell from $37.1 billion to $36.4 billion, although it still remains above the upper band of $36.0 billion.
- Options open interest is holding near $40 billion and remains above the upper band. The volatility spread widened to -22.34%, moving below the lower range, while the 25-delta skew improved from -2.05% to 0.94%, although it remains below the lower band of 3.75%.
- The ETF MVRV ratio declined to 1.34 and remains within its normal range. On-chain activity also slowed, but without moving outside typical levels: fee volume fell to $202.6K, transfer volume to $4.0 billion, and active addresses to 610.8K.
- Capital inflows remain constructive. The monthly change in realized cap increased to 1.0%, well above the upper band of 0.2%, while the STH/LTH ratio at 13.7% and the share of so-called hot capital at 17.6% remain within their standard ranges.
- BTC holders remain broadly profitable, although profitability is gradually weakening. Around 66.2% of supply is currently in profit, while the unrealized profit-to-loss ratio stands at 8.4%; both remain above their upper statistical bands. At the same time, the realized profit-to-loss ratio fell from 1.0 to 0.5, but remains positive.
- Overall, the data points to stronger selling pressure across spot flows, derivatives and ETFs, although Bitcoin is still holding within its broader consolidation range. There are no clear signs of panic, and the market continues to absorb selling pressure at progressively lower price levels. Even so, new capital is entering the market more cautiously.
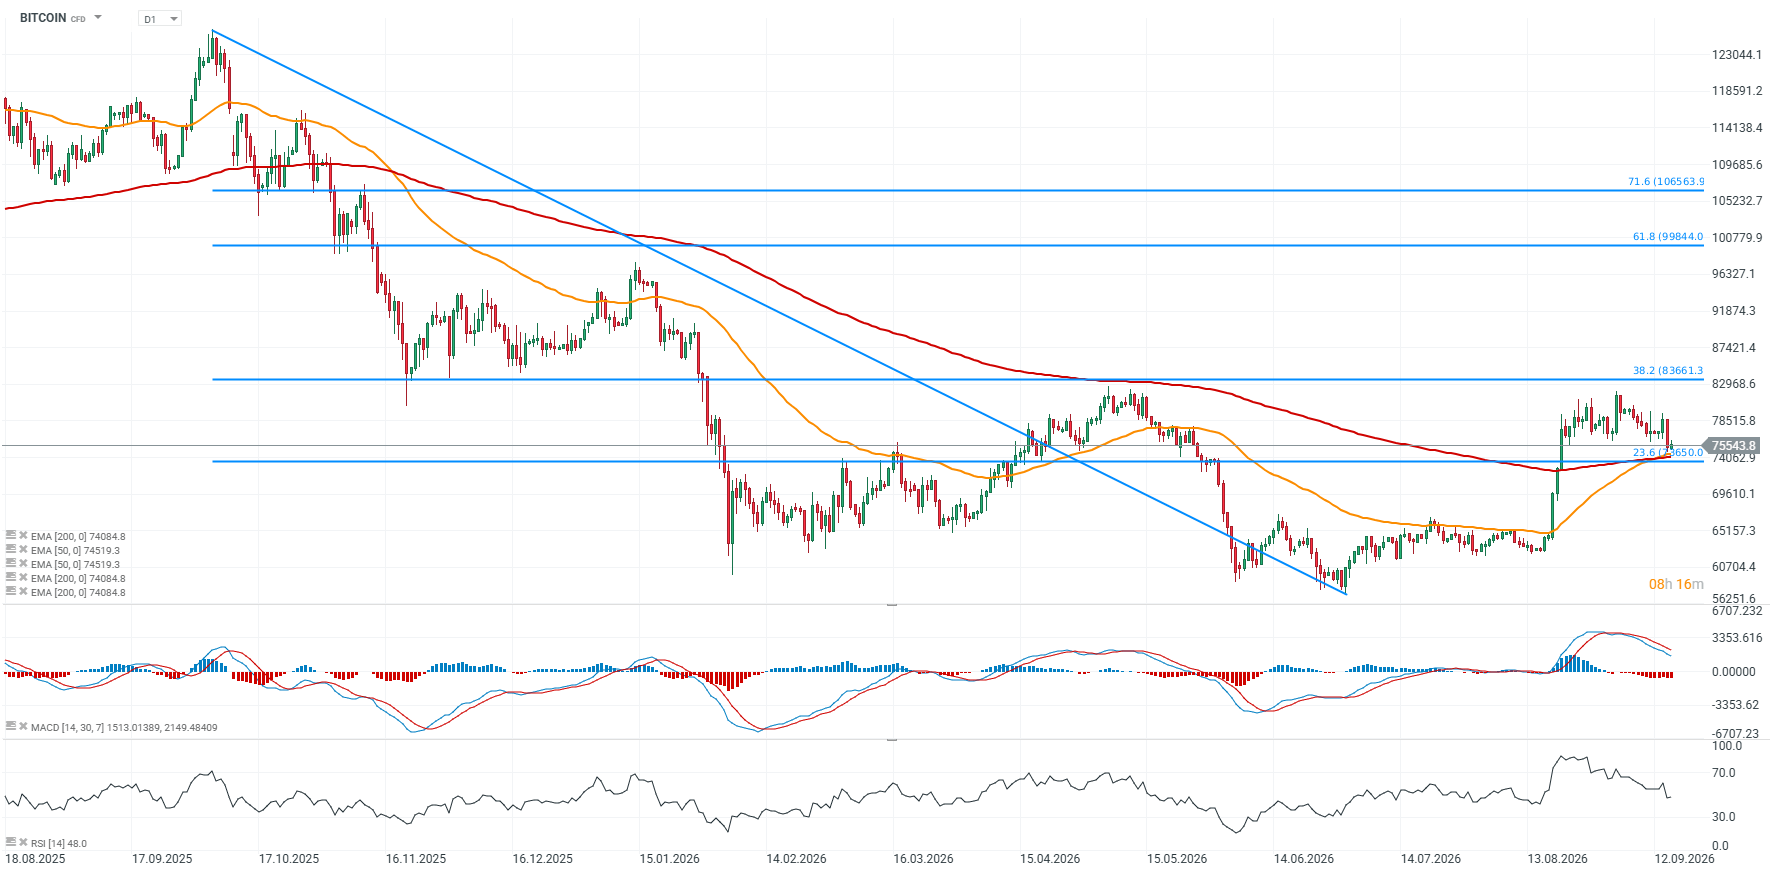
Bitcoin chart (D1 timeframe)
Bitcoin has fallen from around $82,500 to roughly $75,500, ultimately proving that it is not fully immune to the pullback on Wall Street and the strengthening U.S. dollar ahead of tomorrow’s Fed decision. The market now appears almost certain that the Federal Reserve will raise interest rates by 25 basis points. Although such a scenario is not guaranteed and would not automatically imply further declines in Bitcoin, it could certainly weigh on inflows into spot Bitcoin ETFs.
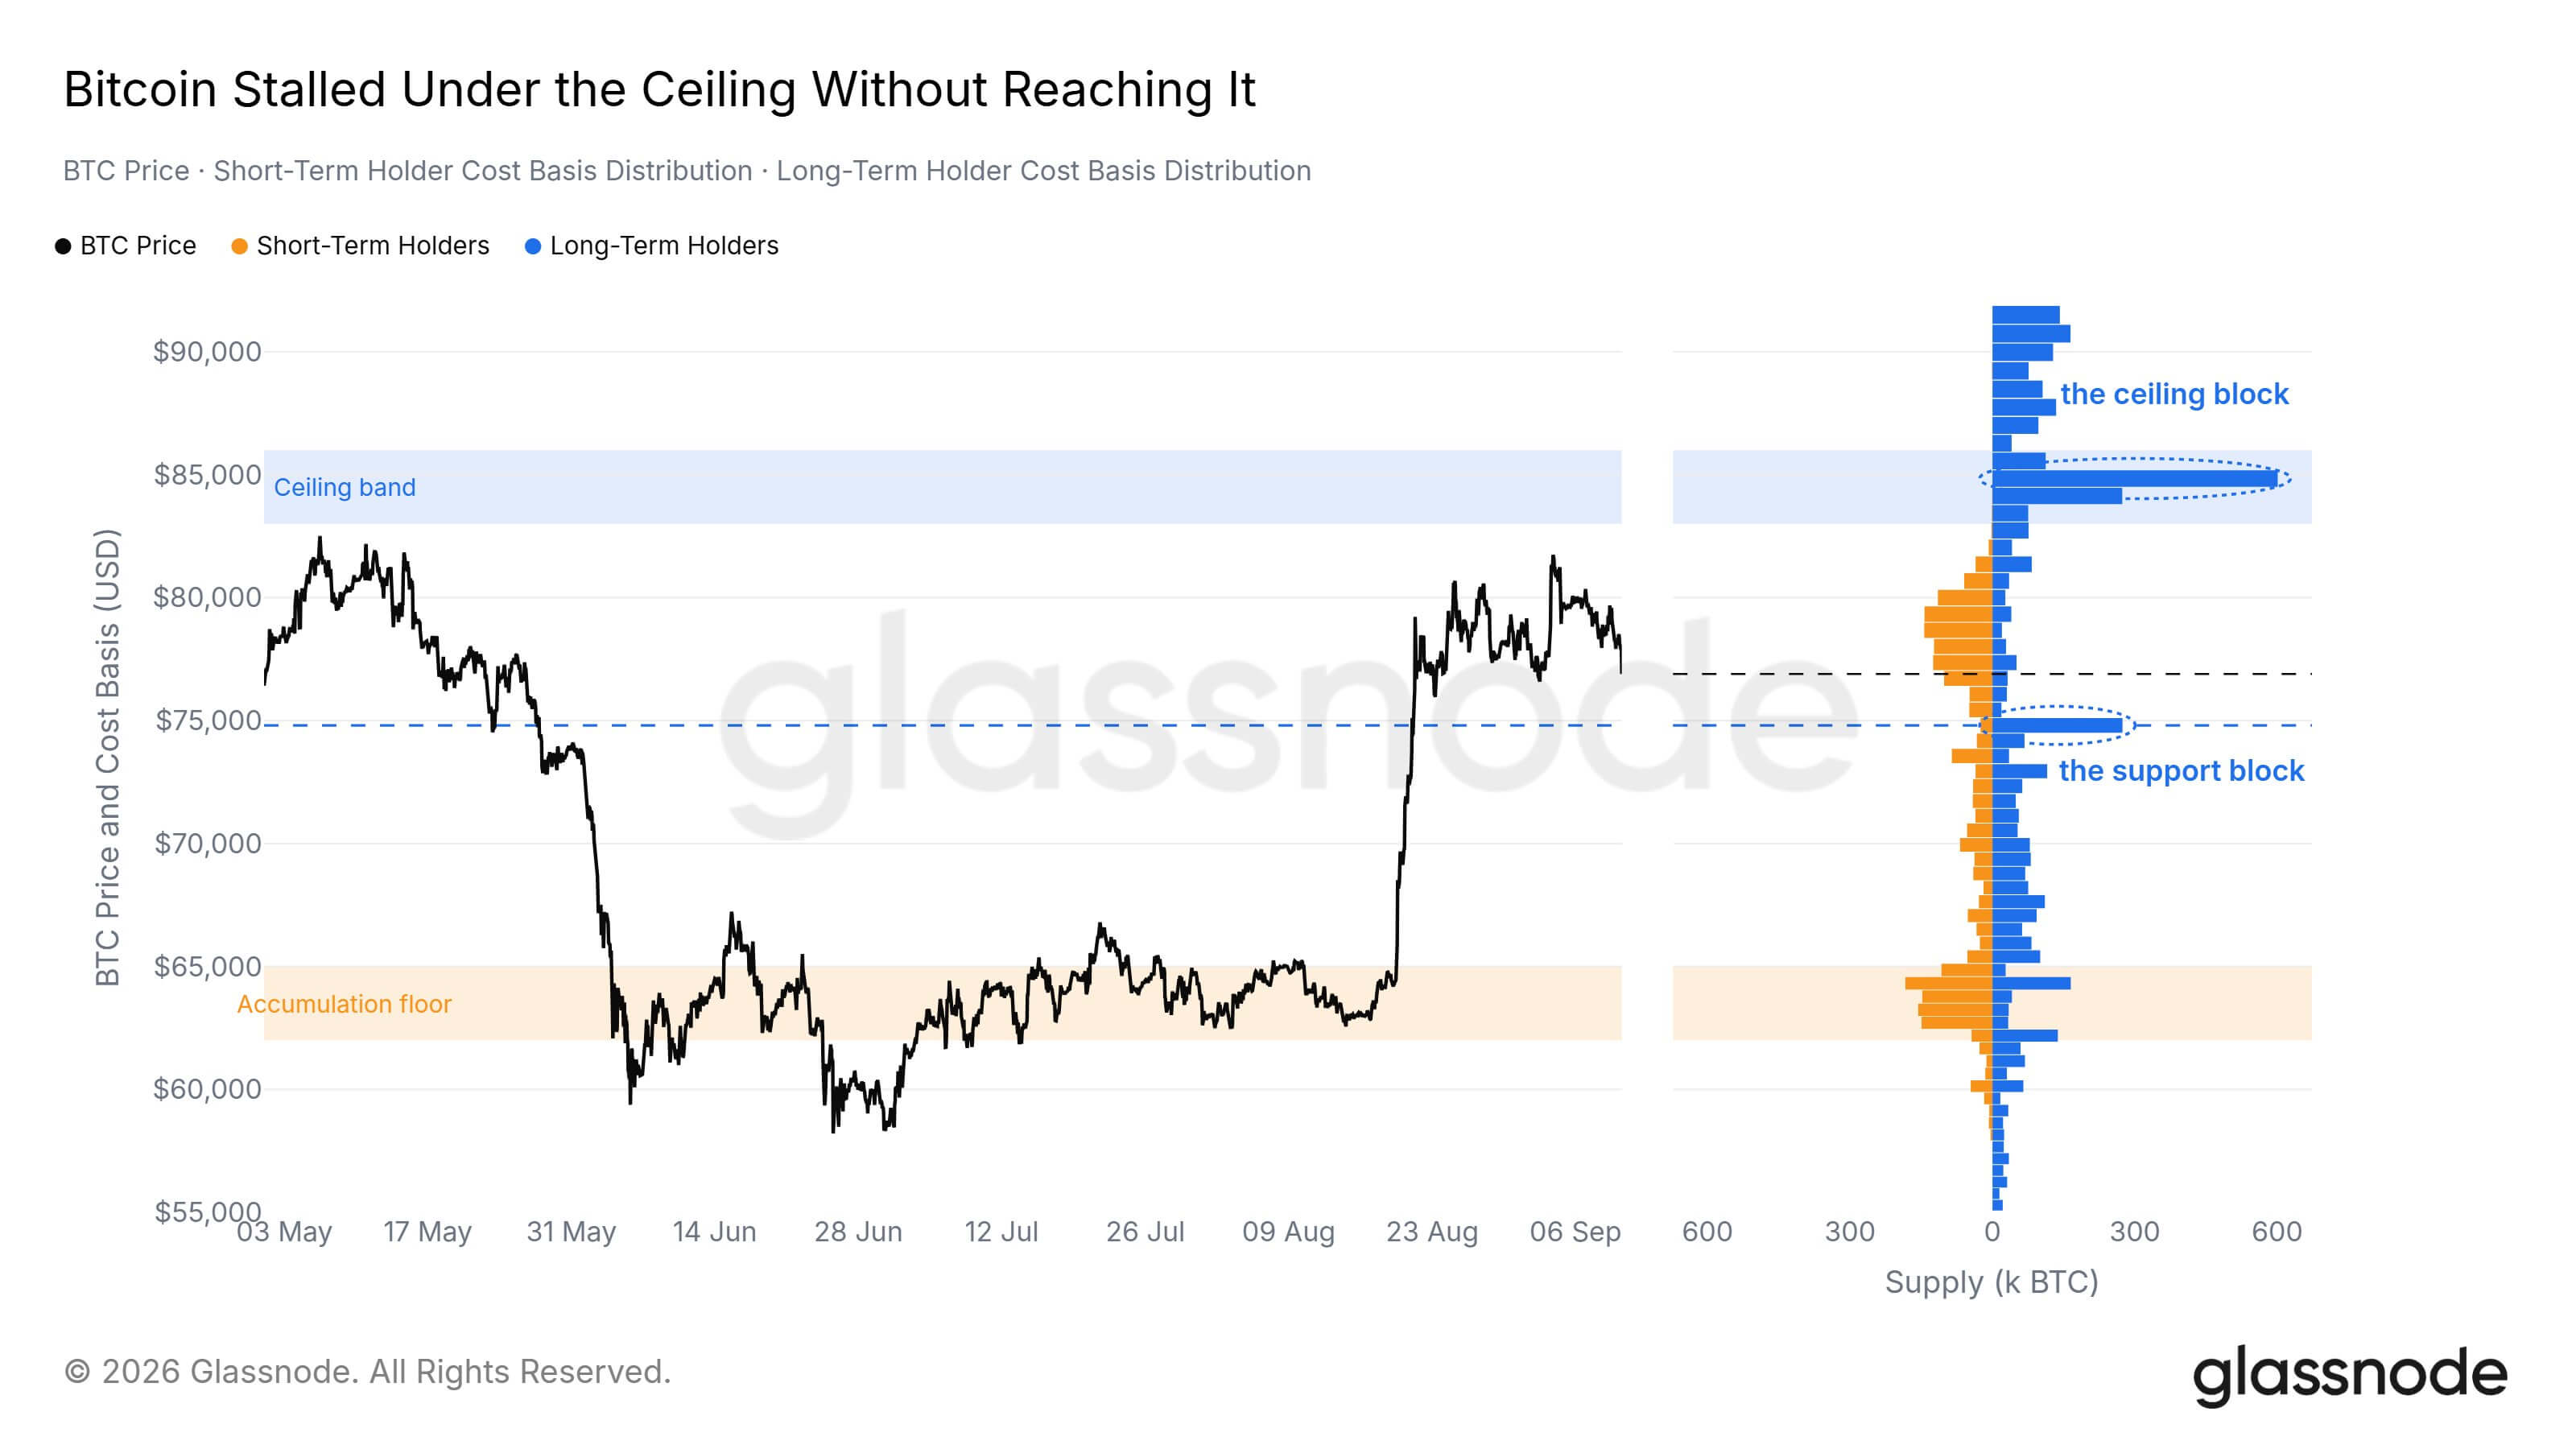
At this stage, Bitcoin has failed another attempt to break above $80,000 and has returned to the downside, retreating toward $75,000. The price remains slightly above two key moving averages, the 200-day and 50-day EMAs (red and orange lines). This area is also important because of the relatively high concentration of liquidity around these levels.
The RSI has fallen to around 48, suggesting that momentum has cooled following the recent breakout attempt, while the MACD is showing a bearish crossover that could be problematic for bulls. Bitcoin is now trading at a point where hopes for a renewed bull market could still prove premature. Holding above $74,000, where the 200-day EMA is located, appears important in the short term, while the $65,000 area remains a key longer-term level. If upside momentum returns, the $83,000–$85,000 zone appears to be the next major resistance area.
Source: xStation5
Source: Glassnode
First Fed rate hike since 2023. What does Bitcoin’s history tell us?
The Fed is approaching a decision that could deliver its first interest-rate hike since July 2023, with markets pricing the probability of such a move at above 90%. A rate hike does not automatically mean Bitcoin will fall. In 2023, BTC reacted very differently to successive Fed moves, so this time the tone of the statement and guidance on future monetary policy may matter more than the decision itself.
One indicator worth watching is STH-SOPR, which shows whether short-term Bitcoin holders, meaning investors holding coins for less than 155 days, are realizing profits or losses. A reading above 1 means transferred BTC is moving at a profit on average, while a reading below 1 points to loss-taking. It is important to remember, however, that a transfer does not always mean an outright sale.
In 2023, SOPR fell below 1 after the February hike, but after the March increase it remained above 1 for much of the period while Bitcoin continued to climb. Loss-taking became more visible after the May decision, while after the July hike SOPR hovered near 1 for some time and only dropped sharply during the August selloff. This shows that not every later move in BTC can be directly attributed to the Fed decision itself.
This time, the key issue may therefore be whether the Fed signals further tightening. If the hike is already largely priced in, a less hawkish message could even trigger a short-term relief rally. For Bitcoin, what matters more than the headline itself is whether STH-SOPR remains below 1 while prices continue to fall, or whether it quickly recovers, signaling that the market is still able to absorb selling pressure.

Source: CryptoQuant
ETF outflows weaken demand for Bitcoin
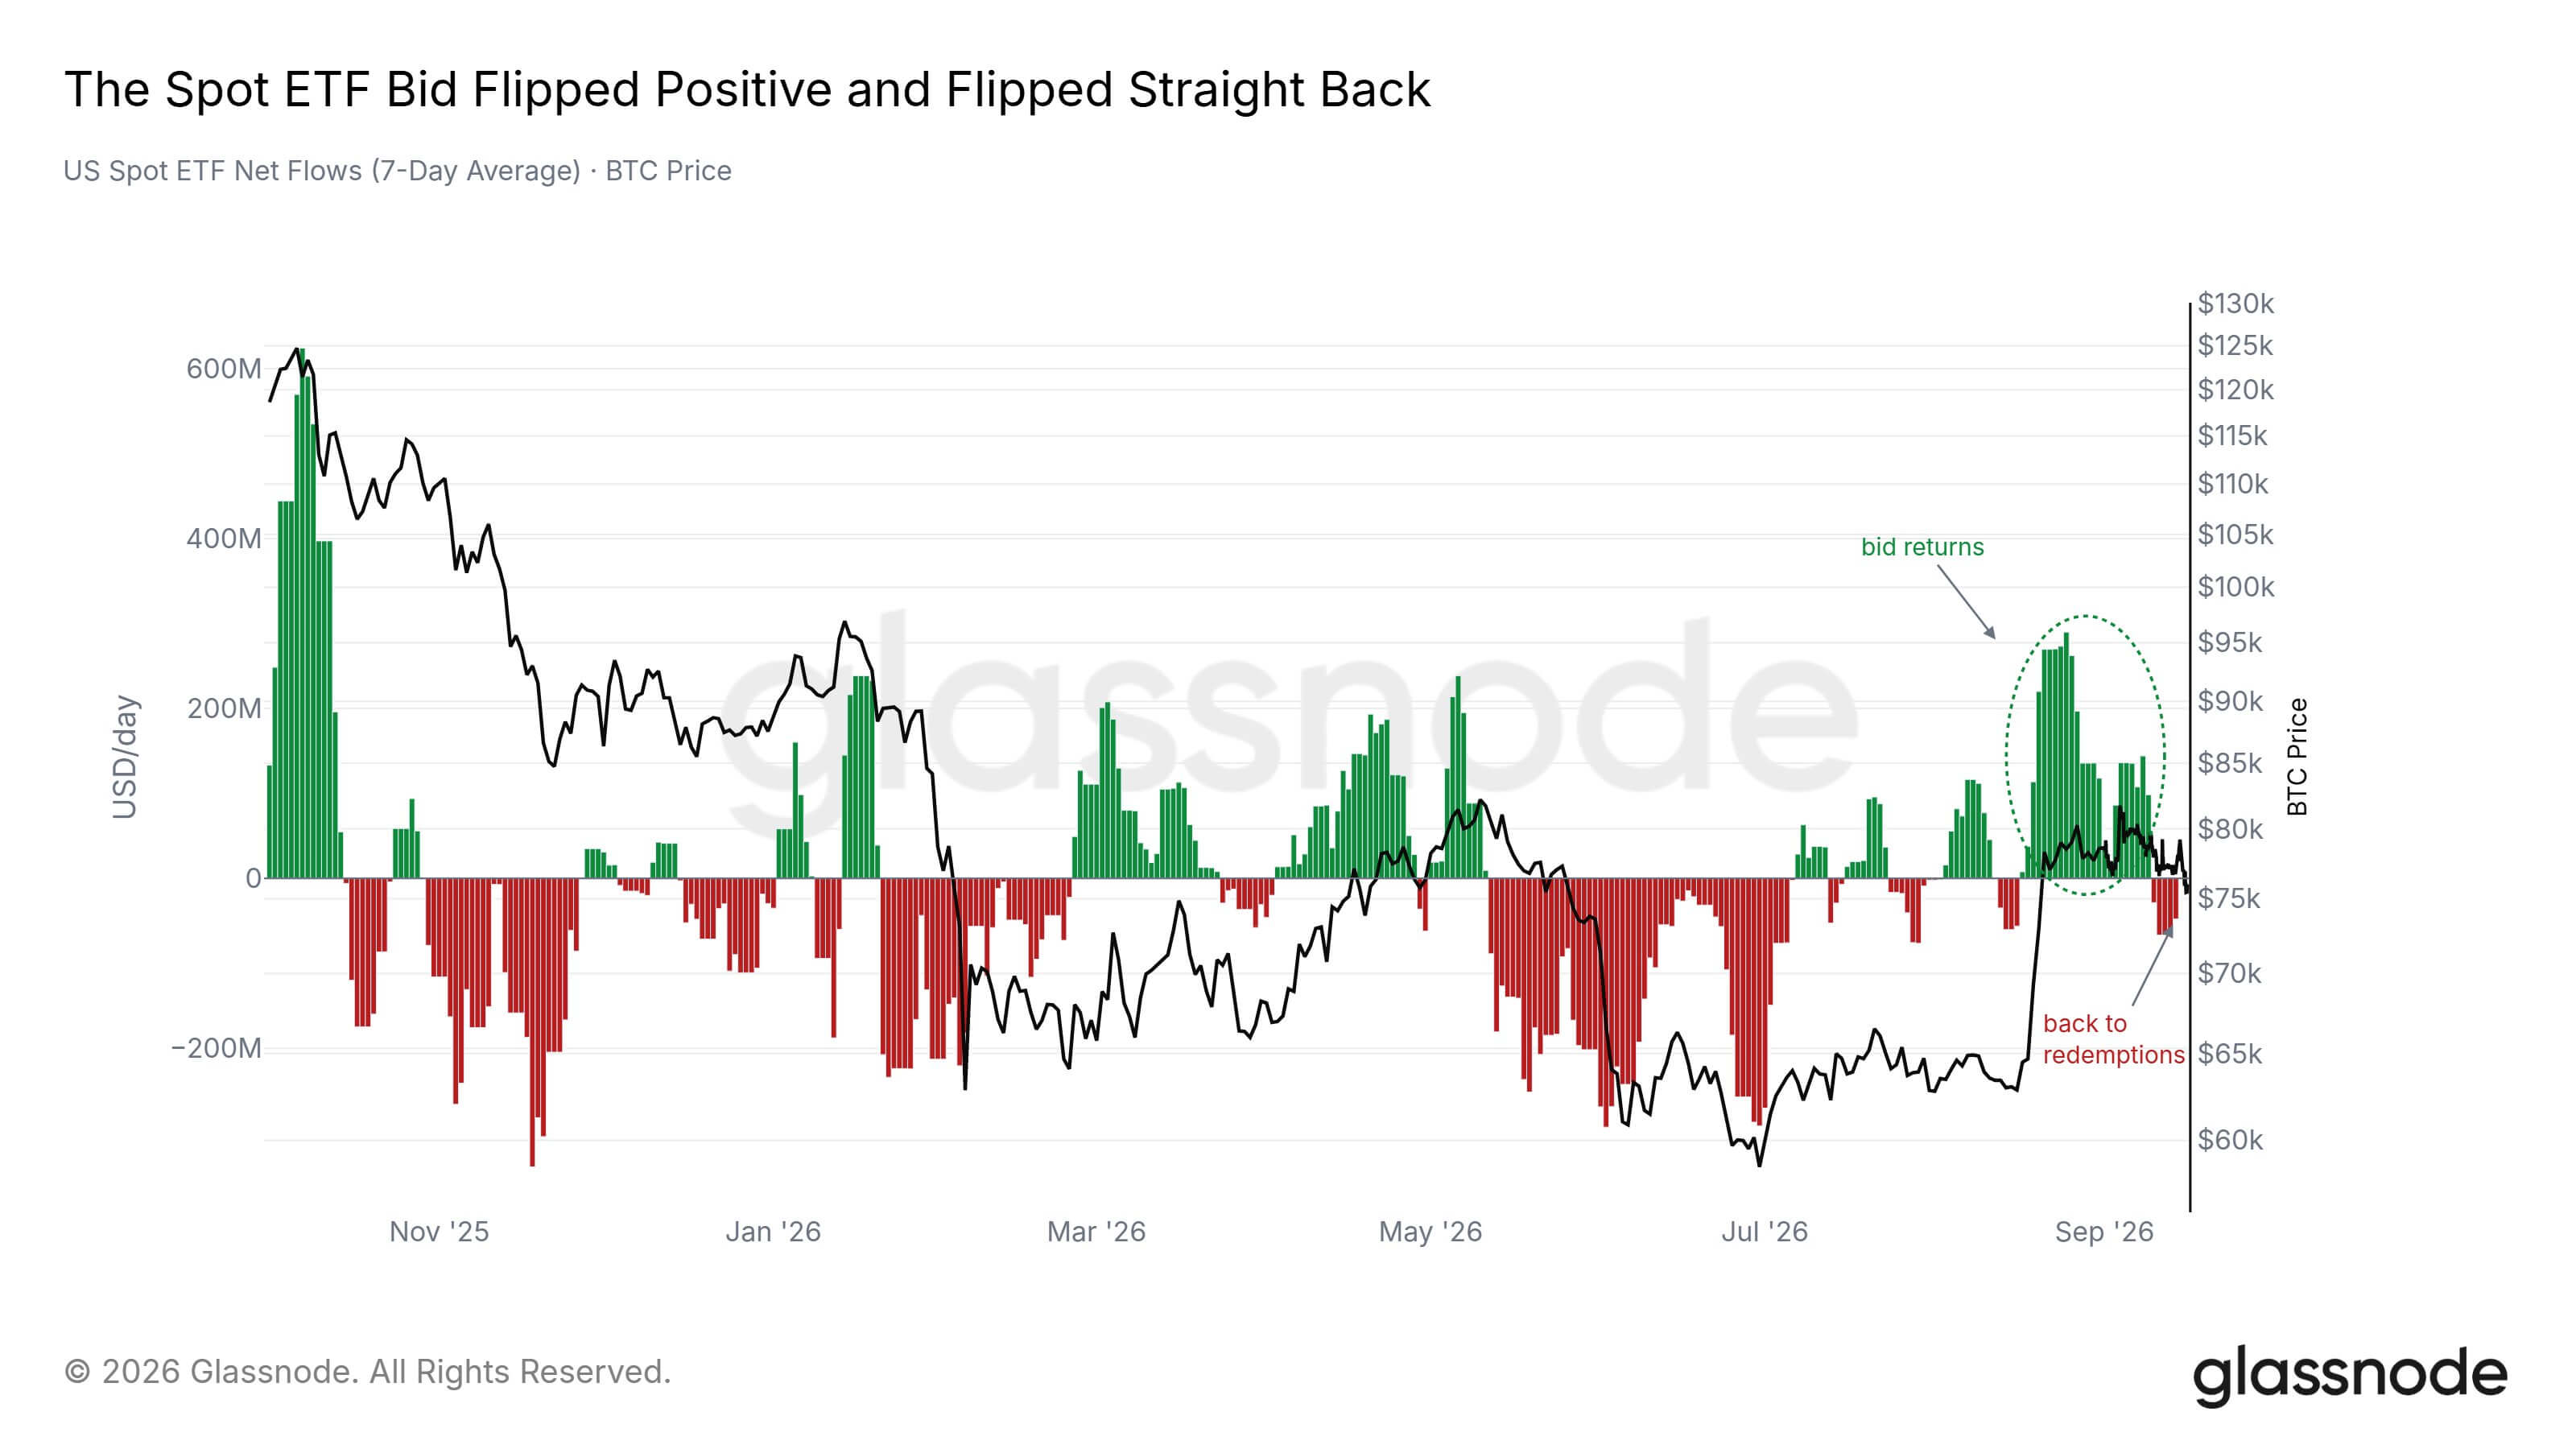
Weekly flows into U.S. spot Bitcoin ETFs shifted from an inflow of $753.2 million to an outflow of $440.5 million last week. In the new week, roughly $150 million of inflows on Monday was quickly erased by more than $450 million of outflows. This points to a clear weakening in institutional demand. At the same time, weekly trading volume fell from $12.1 billion to $8.7 billion, below the lower statistical band of $9.6 billion.
Despite weaker flows, the ETF MVRV ratio remains relatively stable. The indicator declined from 1.39 to 1.34, suggesting that the average ETF position remains profitable, although unrealized gains are gradually shrinking.
The spot market is also showing more selling than buying. Bitcoin is losing momentum, while Spot CVD has fallen to -$142.7 million, indicating that investors are more frequently selling BTC at the prevailing market price than aggressively buying it. Trading volume has declined slightly but remains within a normal range, so there are still no clear signs of panic.
At the same time, a large amount of leveraged positioning remains in the derivatives market. Open interest stands at $36.4 billion, while Perpetual CVD has fallen to -$605.9 million, pointing to very strong selling pressure in futures. This matters because when leverage remains high, even a relatively small price move can accelerate quickly as liquidations are triggered.
Source: Glassnode



Daily Summary: New Records on Wall Street. Markets Await the New Earnings Season



Market Wrap: France’s Budget, Spain’s Elections. Politics Returns to the Markets



Daily Summary: Wall Street Recovers as Micron Shines and Oil Prices Rise Again

Bitcoin weakens under pressure from the dollar. What’s next for crypto prices?