



Bitcoin chart (D1 interval)
Bitcoin has moved above its 200-day EMA (red line) and the 23.6% Fibonacci retracement, both located near $73,500, making this area an important short-term support zone. On the upside, the 38.2% Fibonacci retracement of the latest downward impulse, around $83,500, is reinforced by previous price action and local highs from the spring, suggesting that a breakout above this level would be particularly important for bulls.
RSI remains elevated but has cooled to around 70, while MACD is not currently providing a clear directional signal. The 50-day and 200-day EMAs are also moving toward a potential “golden cross” if Bitcoin continues to advance from current levels.
A weaker-than-expected NFP report would likely support Bitcoin and could potentially accelerate a move above $83,000, opening the way toward a future test of the $90,000 area. On the other hand, a strong labor-market report could keep Bitcoin consolidating below $80,000, potentially within the $73,000–79,000 range at least until the Federal Reserve’s decision in mid-September.
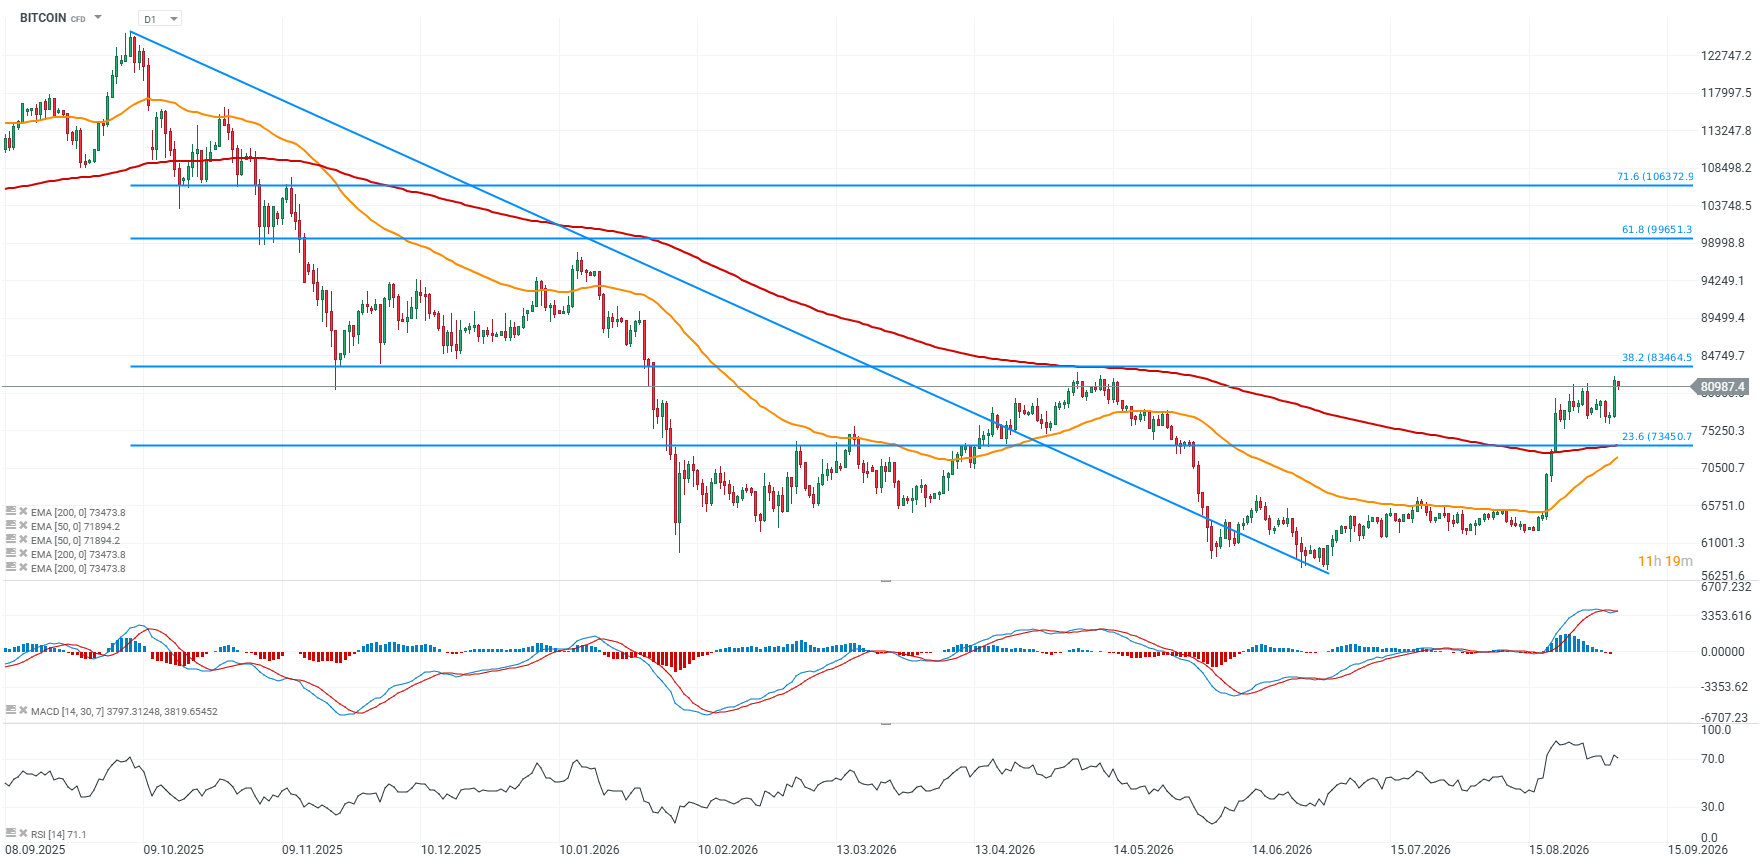
Source: xStation5



US CPI above expectations!🔥📈



Market Wrap: ASML lifts tech sentiment, EU yields pull back


Dollar in Limbo Ahead of CPI 🚨


Economic Calendar: US CPI Inflation Data in Focus (14.10.2026)