
Bitcoin is up nearly 3% today, breaking above $72,000 despite mixed sentiment across global markets. Looking at the daily chart, we can see some similarities to the 2022 bear market.
- In 2021, the declines began in November, and in 2022 Bitcoin entered a full bear market - with three strong downward impulses.
- In 2025, the declines started in October, and we have already seen two strong downward impulses, with the price currently trading more than 40% below the record high.
- Between these waves of decline, a flag pattern was observed, which typically signals a continuation of the downward trend.
- A similar pattern appears to be forming now, with a key resistance zone between $73,000 and $75,000. A sustained breakout above this range could open the door to speculation about a trend reversal.
- If the 2022 scenario were to repeat in some form, Bitcoin could potentially climb above the daily EMA200 around February 2027.
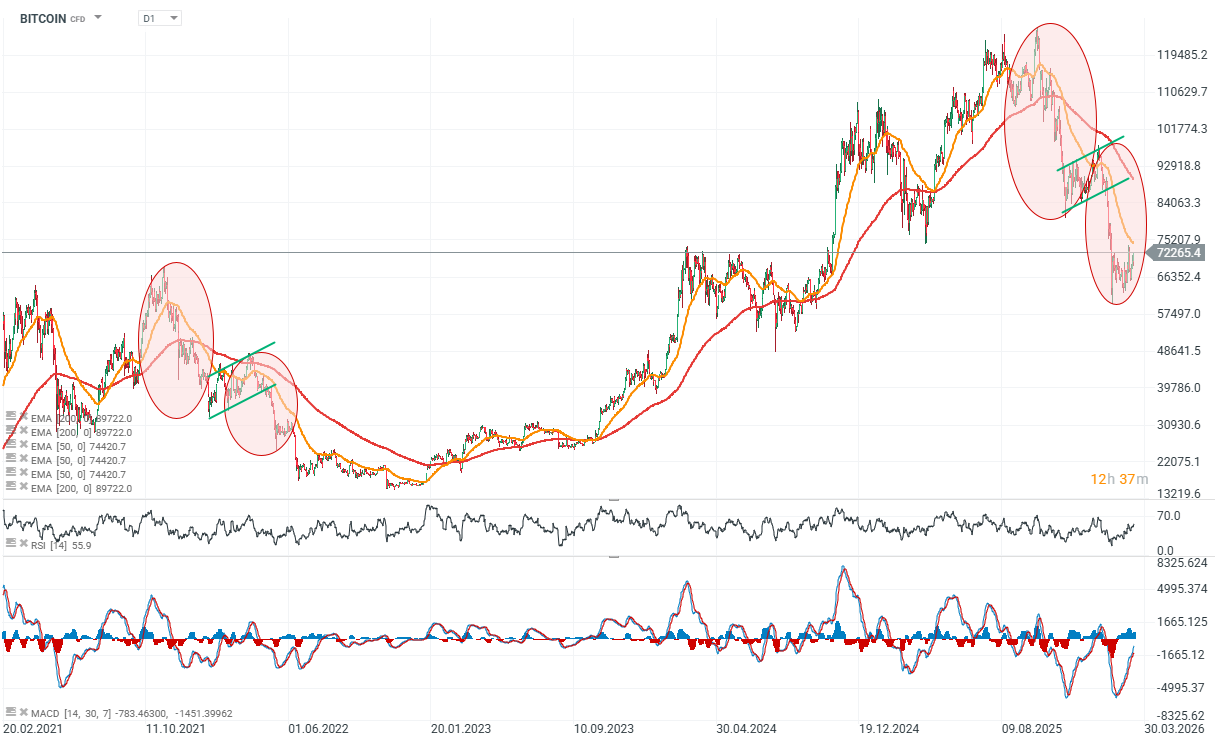
Source: xStation5
Interestingly, in 2022 Bitcoin eventually plunged below the EMA200 (red line), triggering the final wave of panic selling. Currently, the price is trading exactly at the weekly EMA200 (red line). If a decline were to start from these levels and be percentage-wise similar to the drop in autumn 2022, we could expect a 40–50% decline, potentially toward the $35,000–$40,000 range.
A move back above $75,000 and $80,000 could instead suggest strong accumulation and a possible attempt to reverse the current trend.
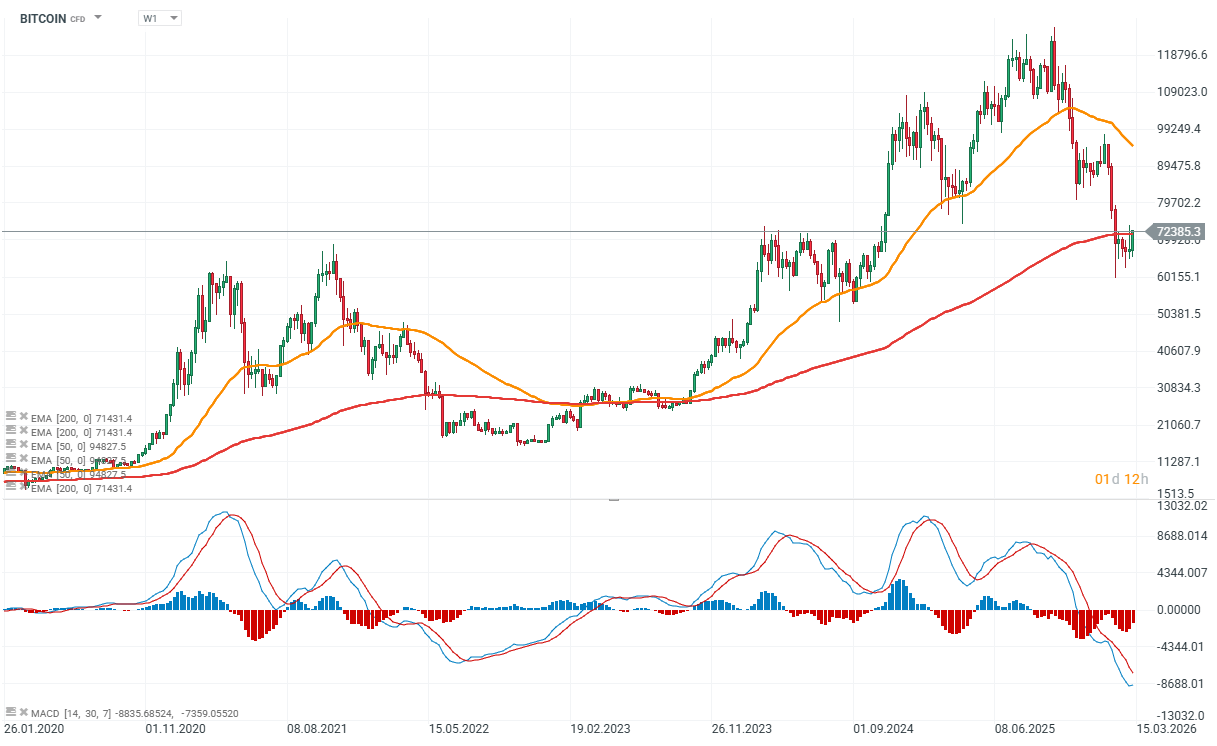
Source: xStation5

Daily Summary: Lower inflation weakens the dollar and awakens gold and S&P 500 to gains
Fed Chair Kevin Warsh’s Q&A from Congress Testimony: Inflation stability is a key

Bypassing Hormuz: Gulf States Race Against Time

US Open: Nasdaq 100 gains 1% 🔼 Software stocks decline, JP Morgan rises after earnings