


- Bitcoin is up around 7% today but still loses 40% from the all-time high
- RSI has climbed to around 84, its highest level since 2023.
- Where is the next major test for the bulls?

- Bitcoin is up around 7% today but still loses 40% from the all-time high
- RSI has climbed to around 84, its highest level since 2023.
- Where is the next major test for the bulls?
Bitcoin is up around 7% today and has risen by approximately 30% from the levels seen last week. At the same time, the RSI has climbed to around 84, reaching its highest overbought levels since 2023. Earlier, the price fell from around $126,000 to below $60,000, which represents a relatively shallow decline compared with previous Bitcoin bear markets, when drawdowns typically reached 70-80%.
However, it is worth noting that Bitcoin's market capitalization has increased many times over during the past 10 years, so it is difficult to directly compare BTC valued today at around $1.5 trillion, with access to Wall Street capital, to the much smaller speculative asset it was in the past. From this perspective, a decline of more than 50% from the peak remains significant and suggests that Bitcoin has already experienced a deep sell-off. Formally, however, the bear market is still ongoing, as the price remains around 40% below its record highs.
Bitcoin breaks above the EMA200 and 23.6% Fibonacci retracement. Next resistance near $84,000
Looking at Fibonacci retracement levels, the price has moved above the 23.6% level, which is located close to the key 200-session EMA200, marked by the red line. The most important technical resistance now appears to be the 38.2% Fibonacci retracement of the decline that began in late 2025, located near $84,000 and additionally reinforced by the local high from May.
If we look back at the 2021-2022 bear market, some similarities can be identified. At that time, the price fell around 40% below the 23.6% Fibonacci level, while the current decline reached approximately 25% at its extreme. There are also similarities between the current rise in RSI and what was observed around the turn of 2022 and 2023, although this does not guarantee that the current momentum has permanently removed the risk of another wave of declines. The technical picture nevertheless remains constructive, as the key momentum barriers represented by the EMA200 and the 23.6% Fibonacci level have been broken. Activity in US Bitcoin ETFs also points to renewed buying interest, which, combined with a previously "cleansed" market, may increase volatility that is currently favoring the bulls.
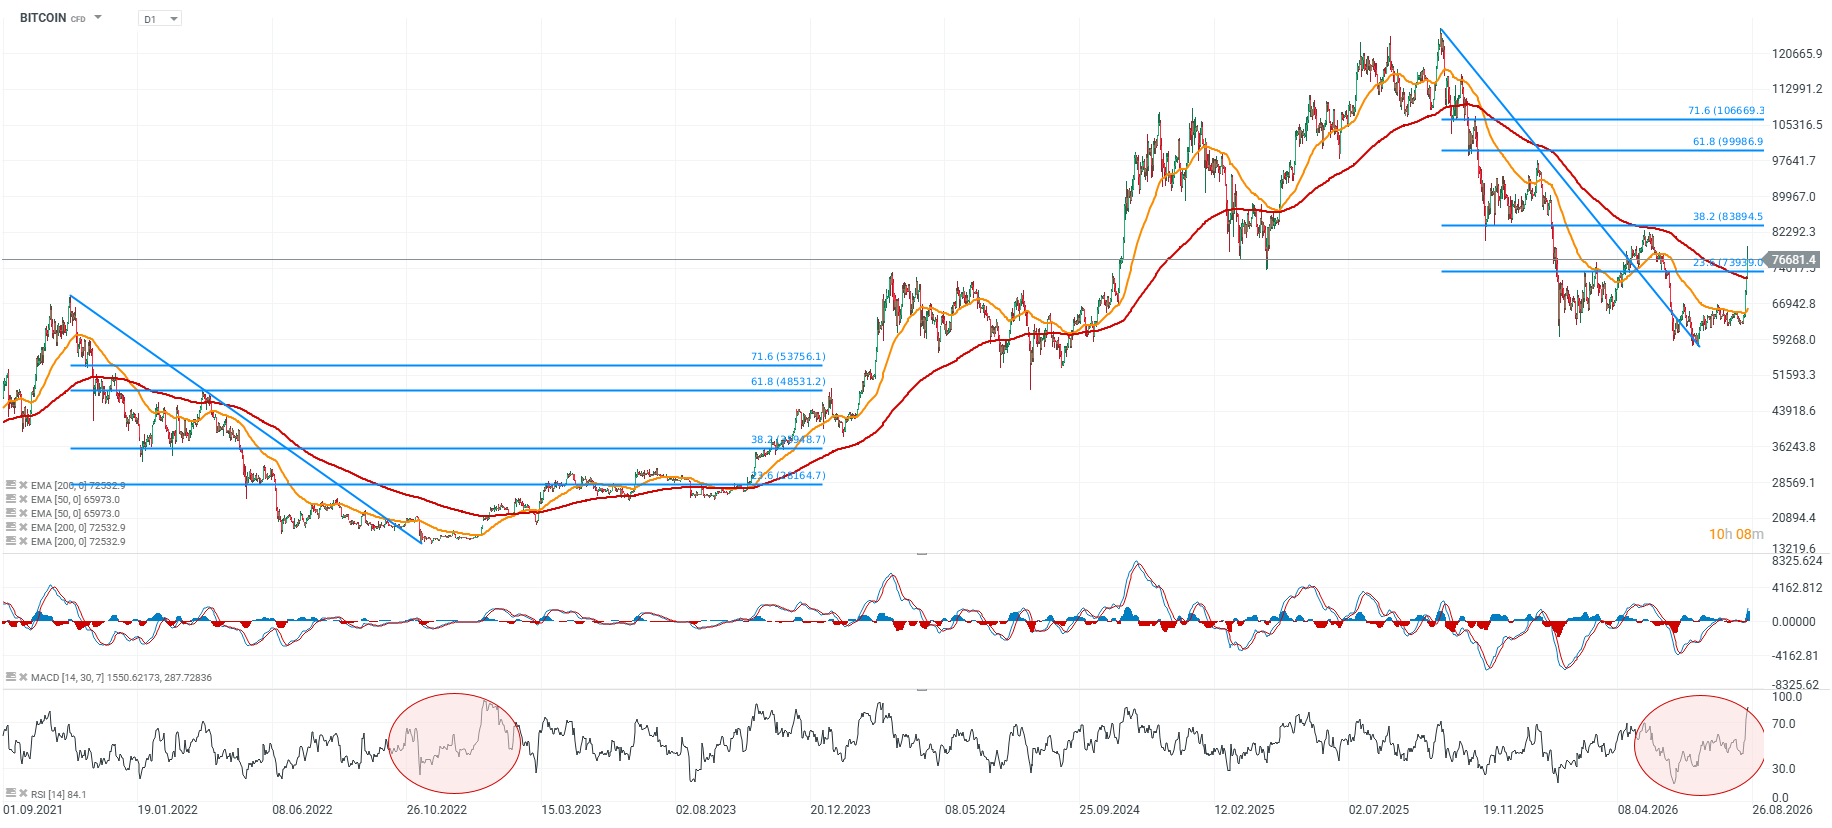 Source: xStation5


Macro Calendar: Preliminary PMI Readings and Earnings Ahead



Morning Wrap: AI profitability concerns spark market Sell-Off



Daily Summary: Valuations Under Pressure, Capital Moves Away From Technology

US OPEN: Earnings misses and rising oil push indexes lower