
Bitcoin has pulled back to around $66,000 and in recent days has failed to recover its losses, despite a rebound attempt in equity indices. Cryptocurrencies are being weighed down by a strong US dollar and a surge in US Treasury yields, which is draining liquidity from risk assets.
- BTC fell from around $76,000 in March to $66,000, marking a decline of approximately 15%. The improvement in spot market activity and a cautious (positive) inflow into ETFs did not provide sufficient support.
- Following the drop from around $94,000 in January, the $74,000–$76,000 zone has already twice acted as resistance, and this area continues to serve as the main technical barrier.
- At the same time, Bitcoin has twice reacted with declines near the 38.2% Fibonacci retracement of the recent downward impulse, which is located around $74,000.
- Currently, the price is trading in the lower range of an ascending price channel, with higher lows still being formed. A break below $66,000 could signal significant weakness and increased selling pressure—a downside breakout.
- The current pattern resembles a flag formation, which is typically a trend continuation pattern—in this case, suggesting continuation of the downward trend.
A drop toward $65,000 could potentially open the way for a deeper selling impulse, while a move back above $70,000 (the first psychological resistance level, further reinforced by price action) could pave the way toward $74,000 and a possible upside breakout from the ascending channel, which would require a move above the $77,000–$78,000 area.
Bitcoin (H1 timeframe)
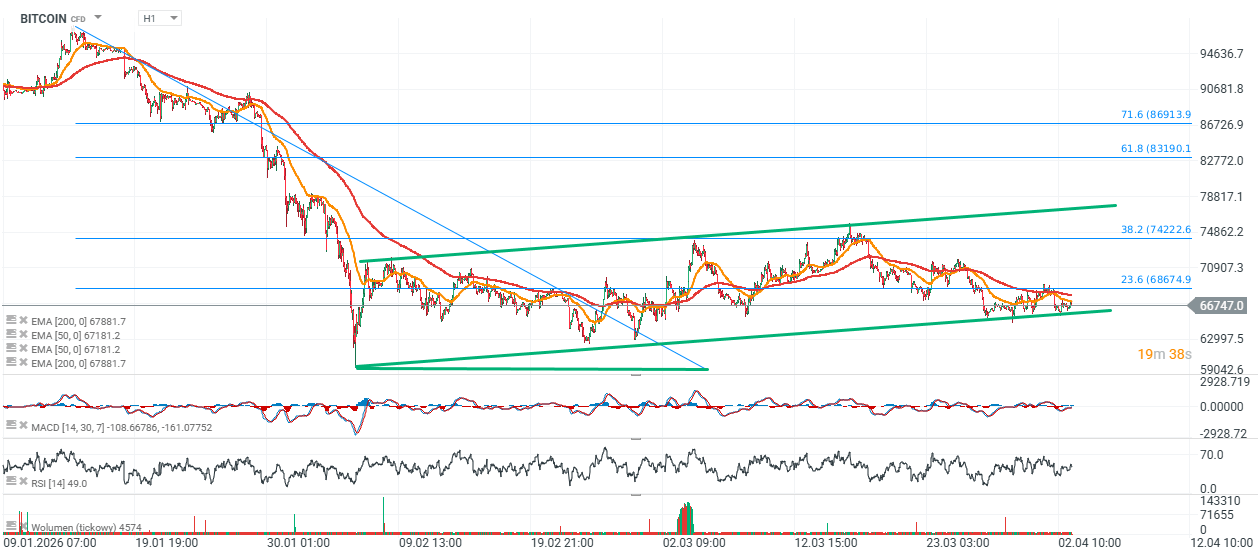
Source: xStation5

US OPEN: Semiconductors drive a rebound

Bitcoin Climbs Above $66,000 as ETF Flows Recover but Glassnode Warns of Higher Volatility

Market Wrap: Bulls Return to Europe Thanks to U.S.-Iran Mediation and Data from Germany

Silver breaks above $59 and attracts capital again. Gold remains in the shadow of its younger sibling