



US Energy Information Administration (EIA) released a weekly report on natural gas inventories at 3:30 pm BST today. Analysts expected the report to show a 19 billion cubic feet build in inventories, slightly bigger than $16 billion reported in the previous week. However, actual data showed a build of just 14 billion cubic feet. This was the lowest reading since early-April when inventory draws were still regular due to seasonal reasons.
NATGAS jumped following the release and traded up to 1.5% higher compared to pre-release levels at one point. However, those gains were quickly erased and prices turned lower later on. Taking a look at the chart at H1 interval, we can see that bulls are failing to push the price above 50-period moving average (green line).
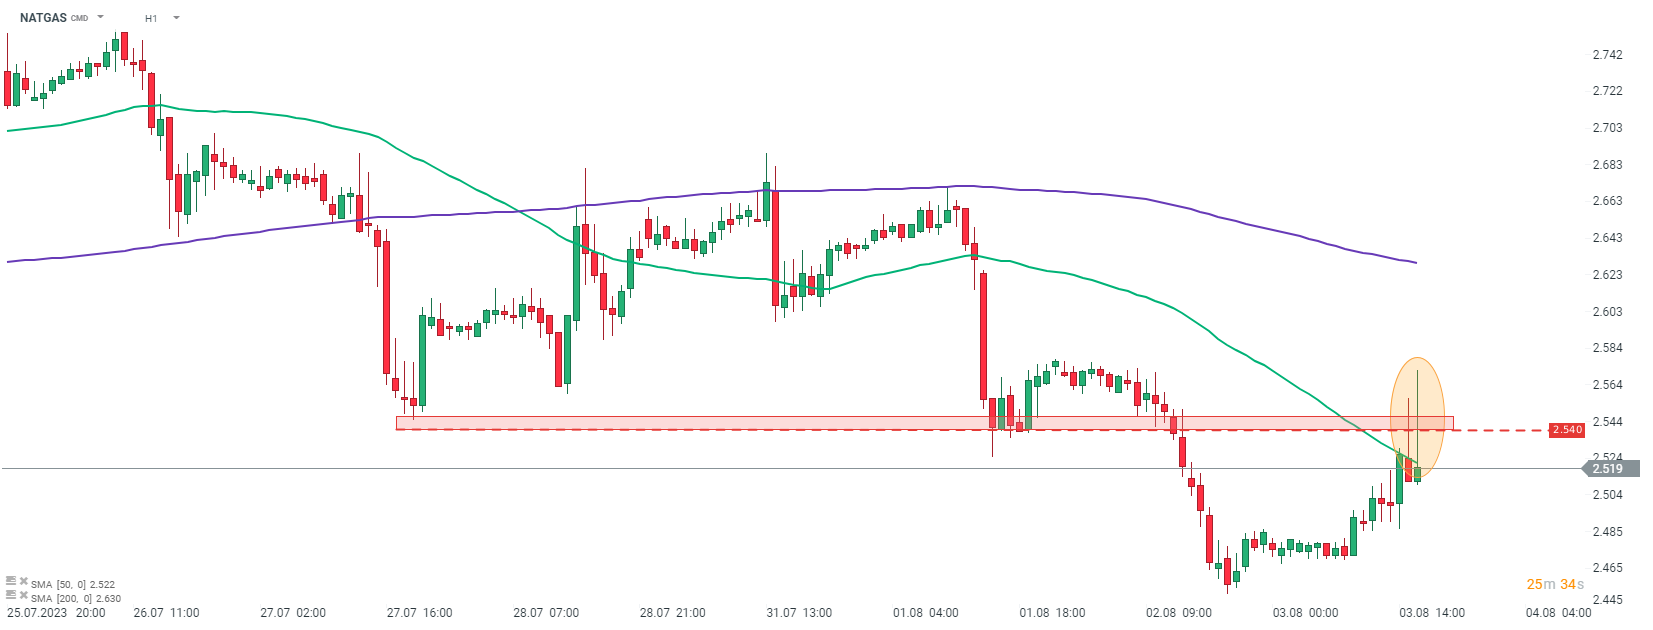 NATGAS at 1-hour interval. Source: xStation5


BREAKING: France slows down, Germany holds on. Euro falls below 1.12



Morning Wrap: AI profitability concerns spark market Sell-Off



Daily Summary: Valuations Under Pressure, Capital Moves Away From Technology

Market Wrap: "Decent" results are not enough – tech stocks fall further; oil highest since May (22.10.2026)