



August advance retail sales beat across the board, and every layer beneath the headline came in stronger than the headline itself. With a 25bp hike already 92% priced going into today's FOMC, the report does not change September but it makes the case for stopping there considerably harder to argue.
Key numbers:
- Headline: +1.2% m/m vs +0.8% expected; prior -0.6% revised to -0.5%
- Ex-autos: +1.4% vs +0.5% expected, a near-triple beat
- Control group: +1.4% vs +0.4% expected, after -0.4% in July; this is the line that feeds PCE goods and GDP tracking
- Ex-autos and gas: +1.2% vs -0.3% prior, the cleanest read of underlying demand
- Y/Y nominal: 6.0% vs 5.01% prior
- Category detail: gasoline +3.1%, nonstore +2.6%, furniture +1.9%, electronics and appliances +1.6%, restaurants and bars +1.2%, sporting goods +1.2%, building materials -0.2%
- Market reaction: minimal. Hike odds unmoved at ~92%, two full hikes still priced through year-end, US10Y above 5%
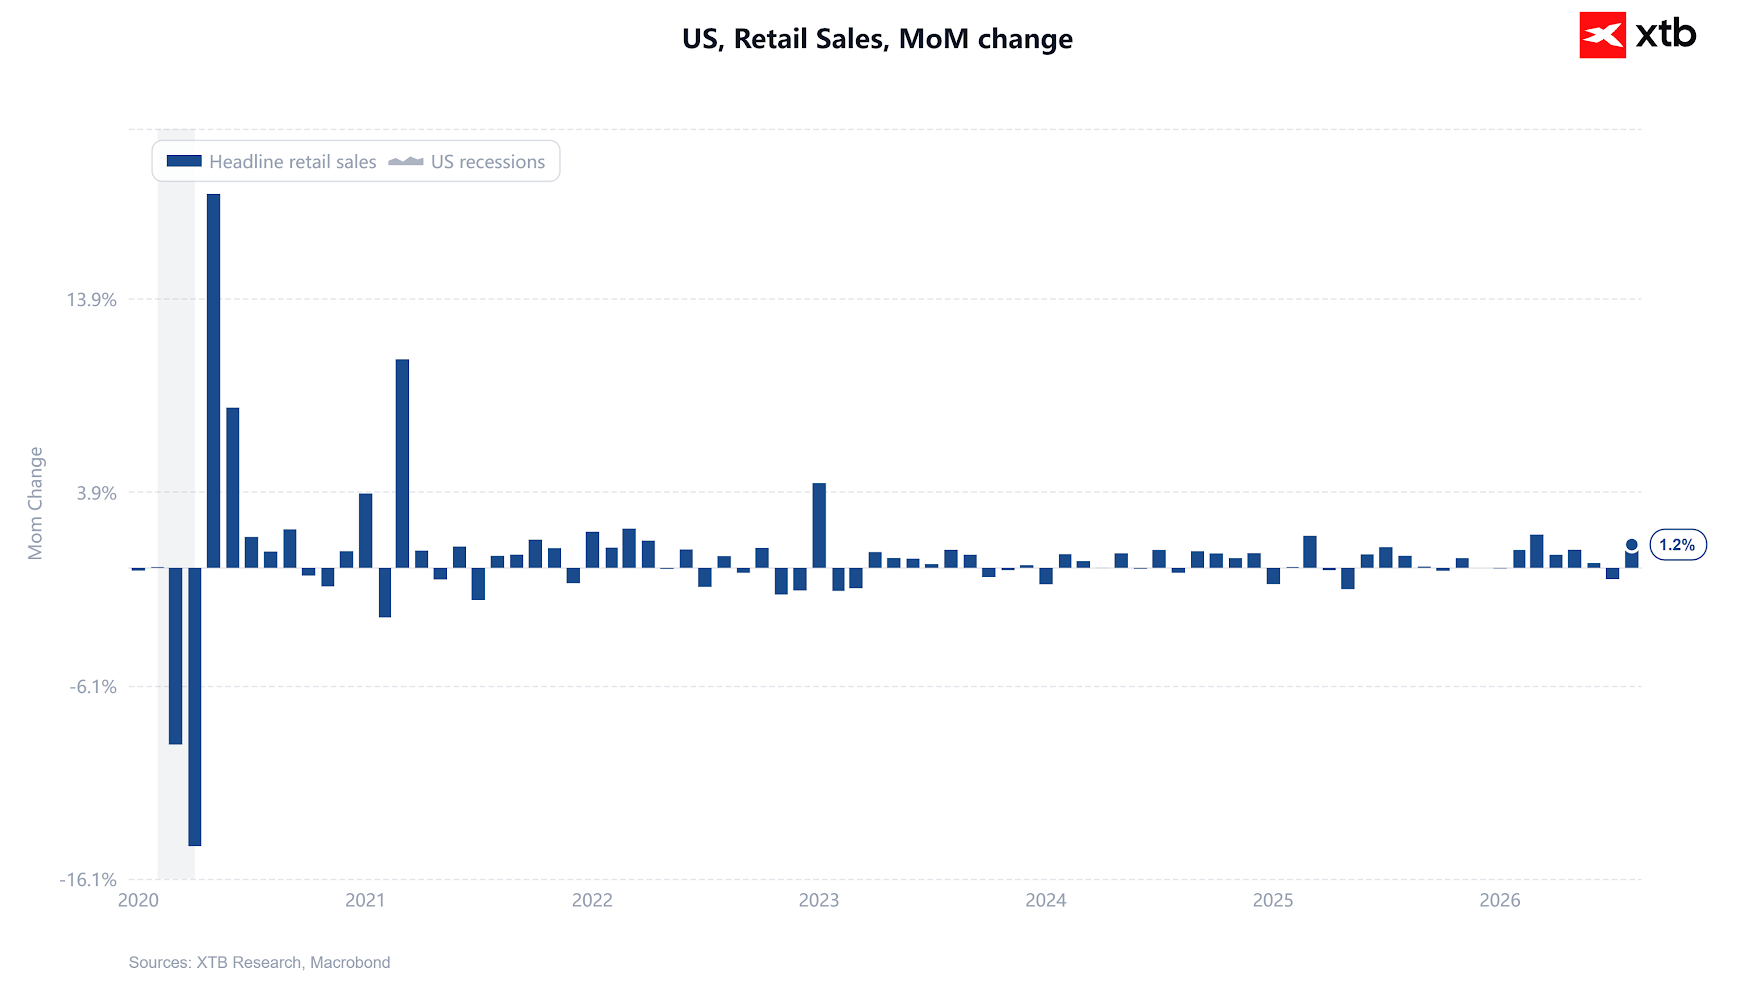
The gasoline objection does not hold
Retail sales are nominal, and August was the month the oil shock hit the pump. Gasoline stations at +3.1% m/m is price, not volume. Brent rose roughly 18% on the month. That is a real distortion of the headline
It is also already stripped out, and the ex-autos-and-gas measure still printed +1.2%. This is the whole story. Higher fuel costs normally act as a tax on the household budget: consumers pay more at the pump and pull back elsewhere. In August they did not. Restaurants and bars, the first line households cut when squeezed, rose 1.2%. Only building materials fell, and barely. The US consumer absorbed a significant energy shock without reallocating away from anything.
Why that matters for the Fed
Central banks are supposed to look through supply-side energy shocks, and the case for doing so rests on one assumption: that the shock destroys demand on its own. This report falsifies that assumption. When spending is strong enough to swallow a fuel price spike whole, the conditions for second-round effects are in place, firms facing higher input and freight costs will discover they can pass them on.
It also kills half of the equity market's stagflation narrative. The S&P 500 has slid to six-week lows on the assumption that an energy shock plus a tightening Fed produces a growth accident. This data says there is no "stag" right now, only the "flation." That is a worse mix for bonds than for stocks.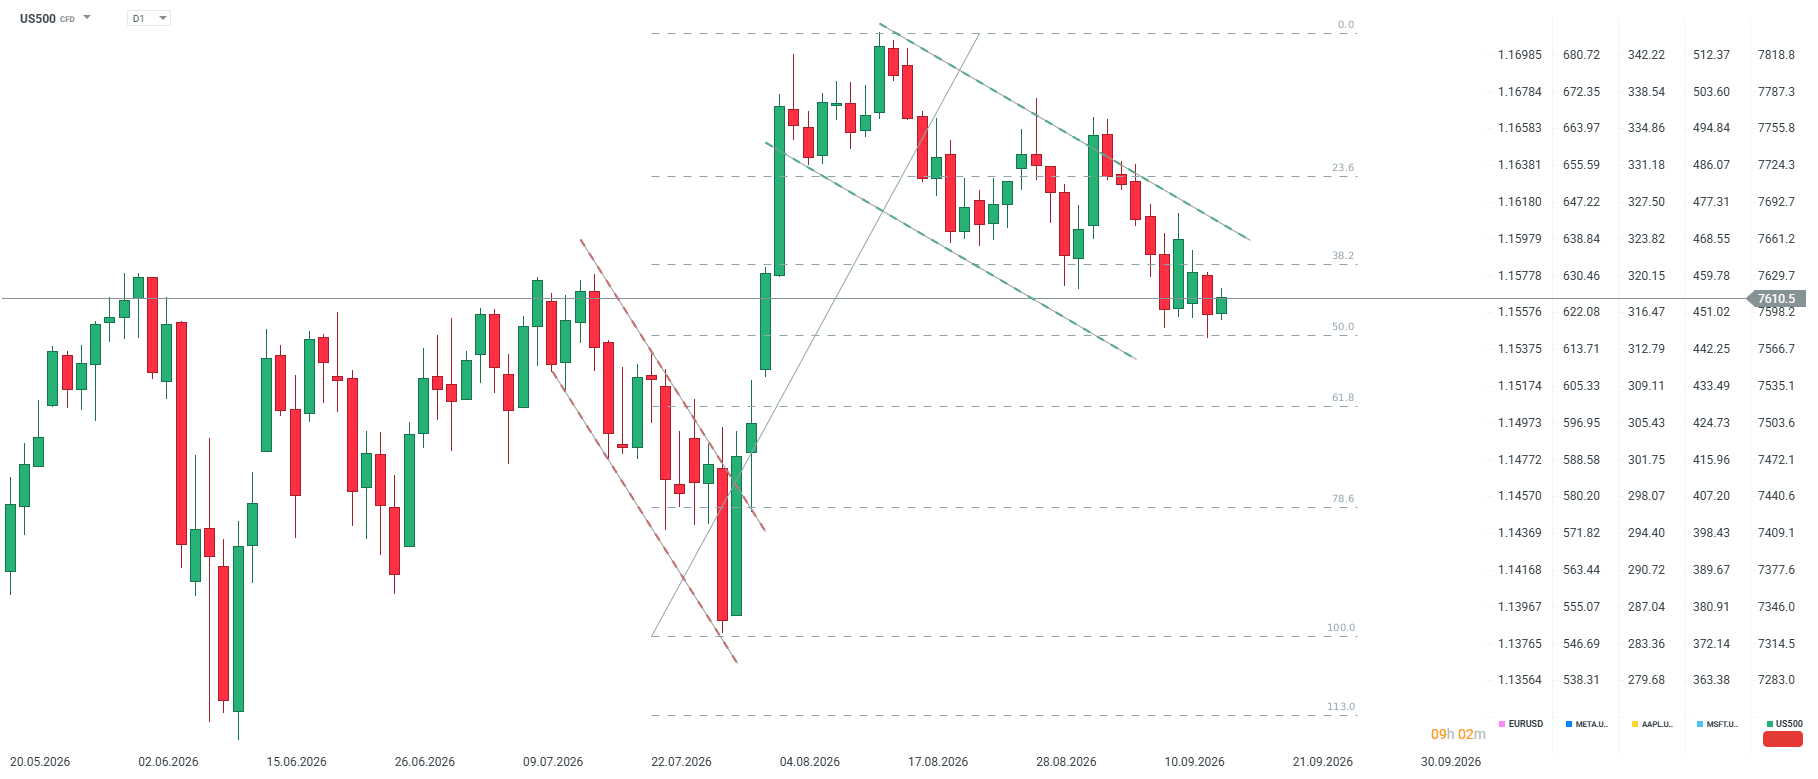 US500 is up today after hitting the lowest level since August 3. However, in first minutes after the data release, US500 lost about 7 points. Source: XTB
Three caveats, none of them dovish
This is a rebound from a negative month, so the two-month average is far more pedestrian than the headline implies. Some of the strength in furniture and electronics has the signature of pull-forward buying ahead of expected price increases, which borrows from future quarters, but is a symptom of unanchored inflation expectations and therefore an argument for hiking, not against. And energy-driven crowding-out usually works with a one- to two-month lag, so its absence in August says nothing about October.
The configuration the Fed faces is uncomfortably simple: a supply-side inflation impulse arriving while the demand side shows no sign of cooling. That is when central banks hike, and keep hiking.

Economic calendar: quiet Wednesday, FOMC protocol and oil market in focus 🛢️



Morning Wrap (07.10.2026)



Daily Summary: New Records on Wall Street. Markets Await the New Earnings Season

S&P 500 Hits New Record High