



PCE (Personal Consumption Expenditures):
-
U.S. Personal Spending (m/m): 0.5% (forecast: 0.6%, previous: 0.9%)
-
PCE (m/m): 0.5% (forecast: 0.5%, previous: 0.3%)
-
PCE Core (m/m): 0.3% (forecast: 0.3%, previous: 0.2%)
-
PCE (y/y): 3,6% (forecast: 3.6%, previous: 3.4%)
-
PCE Core (y/y): 3.1% (forecast: 3.1%, previous: 3.1%)
-
U.S. Personal Income (m/m): 0,2% (forecast: 0.3%, previous: 0.2%)
Why these data matter:
PCE (Personal Consumption Expenditures) measures changes in consumer spending and is a key gauge of inflation in the U.S. The PCE Core index, which excludes food and energy prices, reflects “core inflation” and is closely watched by the Federal Reserve for interest rate decisions. Rising consumer spending signals strong demand in the economy, while declines or stabilization suggest moderate growth and lower inflationary pressure.
GDP:
-
U.S. GDP (annualized, preliminary): 3.4% (previous: 2.2%)
-
Personal Consumption (annualized): 3.8% (previous: 3.8%)
-
GDP Deflator (q/q): 2.2% (previous: 6.1%)
-
Core PCE (q/q): 2.5% (previous: 3.3%)
Why these data matter:
GDP measures U.S. economic growth, while personal consumption reflects consumer demand. The GDP deflator and Core PCE track inflation, with Core PCE closely monitored by the Federal Reserve. Stronger growth supports the U.S. dollar and may delay rate cuts, while easing inflation could support monetary easing and lower Treasury yields.
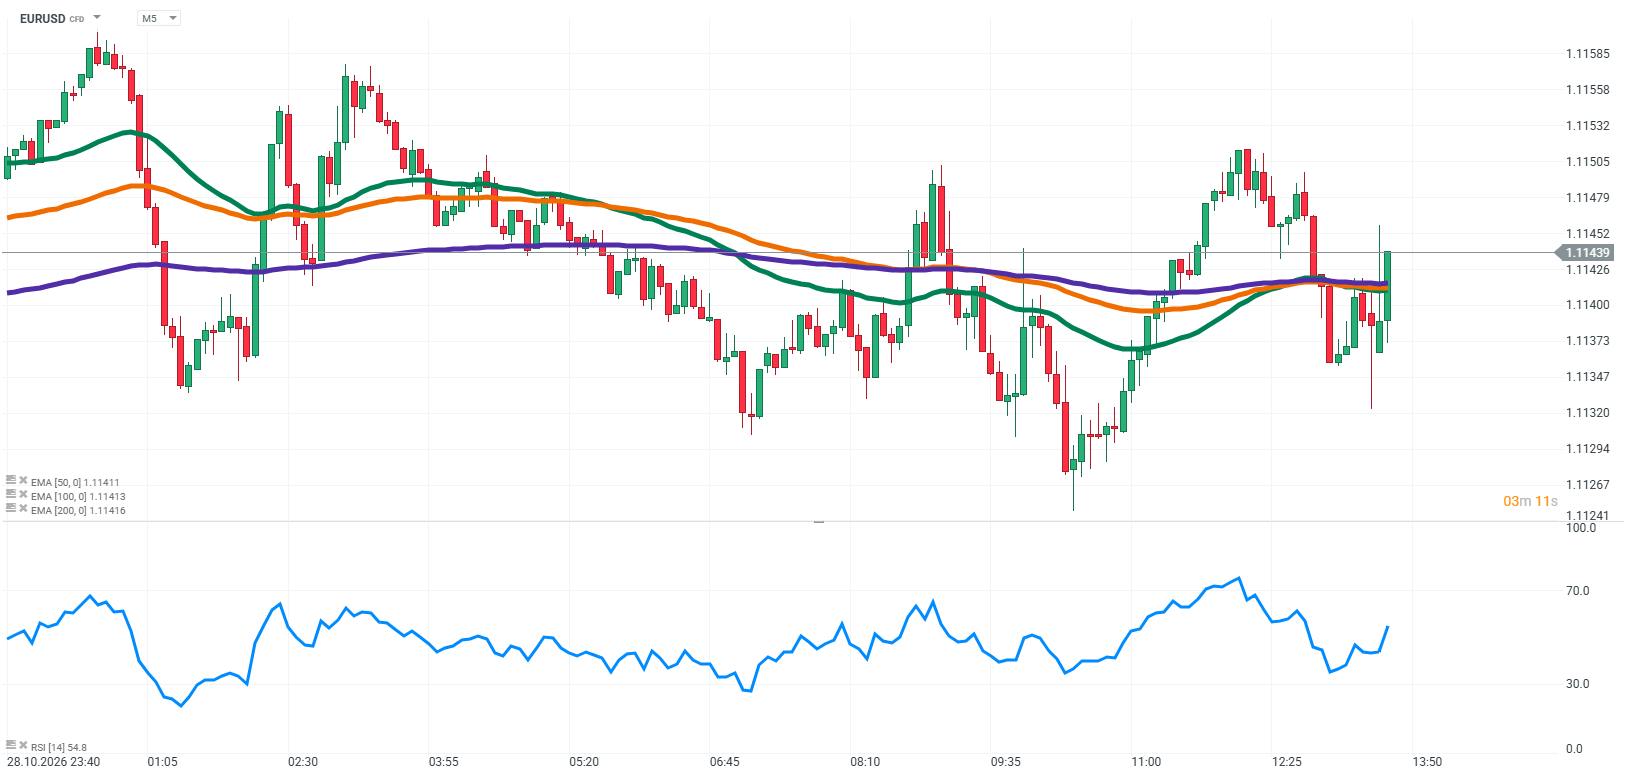
Source: XTB Research



ECB Holds Rates Unchanged💶 EURUSD down 📉
There is no good scenario for the euro today

Economic Calendar: ECB Decision, PCE Inflation, and Amazon Earnings in the Spotlight 🚨



Morning Wrap - Key Information to Start Your Day 💡