
Spare for brief moments of euphoria and recovery, risk-off moods continue to dominate on the global markets. USD is one the rise while risk assets, like equities or cryptocurrencies, are pulling back. However, there was some disconnect between global equities and AUDJPY, a currency pair traditionally seen as a risk barometer. This disconnect was driven by JPY weakness, which has lost some of its safe haven shine amid struggles of monetary policy, or more precisely, lack of actions from the Bank of Japan. Nevertheless, the correlation between AUDJPY and stocks has revived during the ongoing sell-off.
Taking a look at AUDJPY chart at D1 interval, we can see that the pair slumped over 6% from mid-September high. The pair is currently testing the 92.40 support zone, marked with price reactions from the past half a year. In case a break below occurs, a test of 200-session moving average (purple line, 91.75 area) will likely come next. However, a key support to watch can be found lower at 91.10 and is marked with the lower limit of the Overbalance structure. A break below it would, at least in theory, hint a bearish trend reversal.
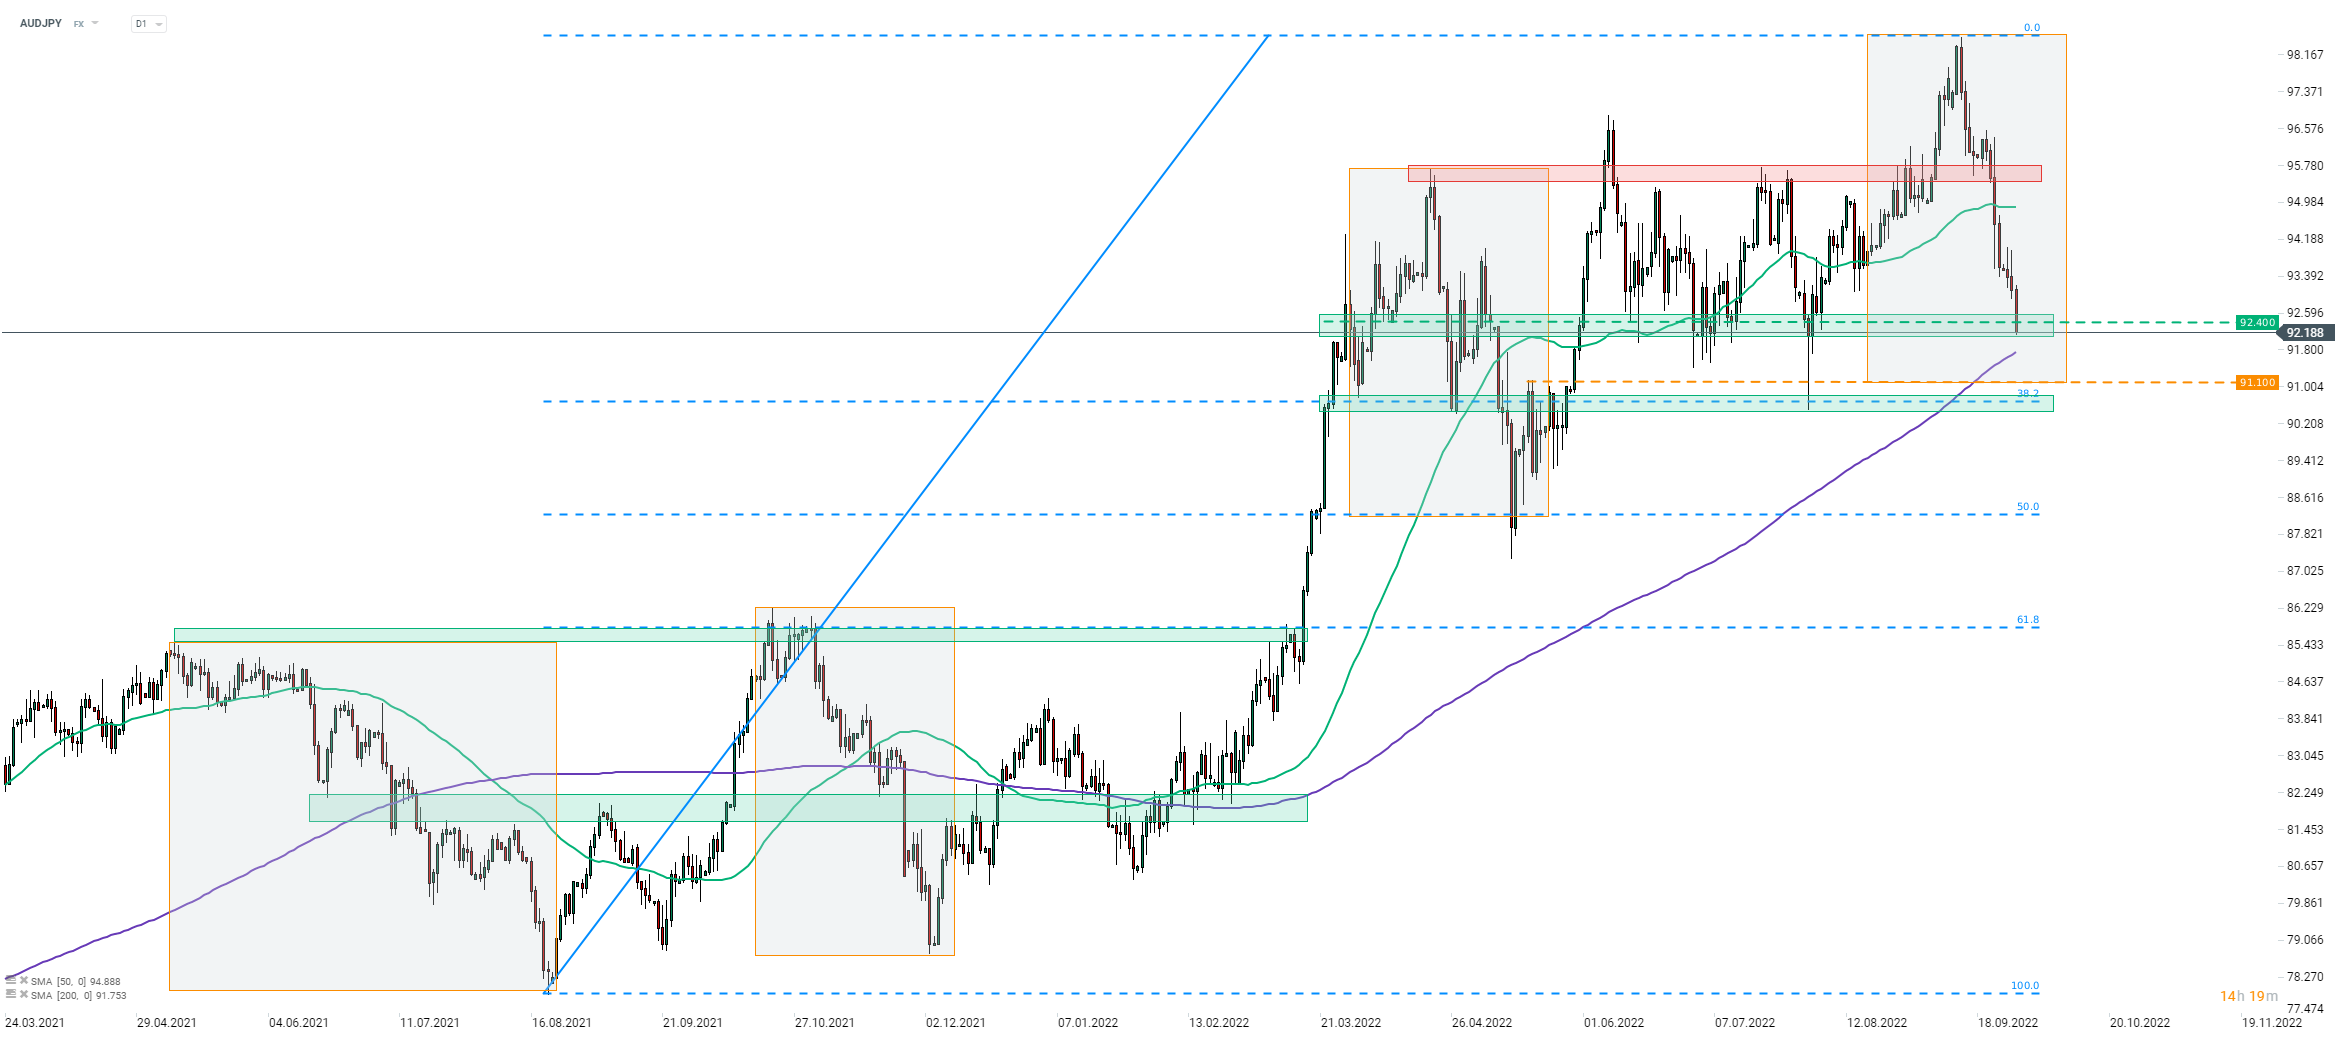 Source: xStation5

Economic Calendar: Time for Tesla and Google Earnings (22.07.2026)

Morning Wrap: AI companies and gold back in favour? (22.07.2026)

Daily Summary: Semiconductors Rise in the Shadow of Geopolitical Turmoil

Market Wrap: Airlines Under Pressure, Europe Resists Expensive Oil