
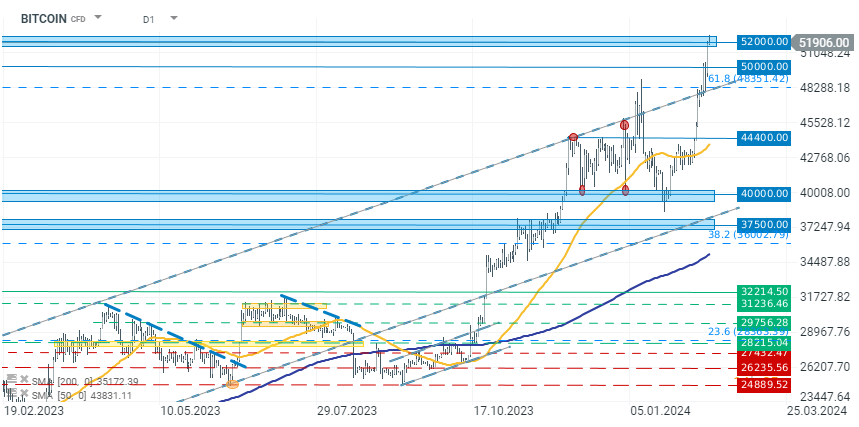
Bitcoin has experienced almost parabolic growth in recent days, and in the first part of today, the price of Bitcoin exceeded the $52,000 level for the first time. The zone between $50,000 and $52,000 is a significant resistance level, so breaking through it could lead to a dynamic continuation of the movement. The main fuel for the rise has been the setting of new highs on Wall Street indexes, investor concerns about the condition of regional banks, and new massive inflows into ETFs.

Bitcoin Chart (D1)
The nearest resistance for bulls is around $52,000. Therefore, overcoming this zone will be key for the continuation of the rise. However, after the recent euphoric increases, a correction in Bitcoin seems reasonable. Bitcoin has also broken out of the growth channel it had been in since the beginning of 2023, and all indicators are currently very heated. Looking at a potential correction, the levels to watch are precisely $50,000 and $48,000. In the event of Bitcoin entering a consolidation phase, capital from the main cryptocurrency may start to flow into Ethereum or even smaller projects.
 Source: xStation 5

Market Wrap: Geopolitical déjà vu. Hormuz once again in the center of investors' attention.

Daily Wrap: Technology Leads Wall Street Higher. Markets Shrug Off US–Iran Tensions

Morning Wrap It's getting hot in the Persian Gulf again, oil is back in the spotlight.

📈 Bitcoin climbs above $62K