
Bitcoin’s move back above $74,000 looks like a genuine relief rally, but not one investors should treat as a confirmed breakout. What we’re seeing is a broader return of risk appetite, helped by a softer geopolitical tone around Iran and the Strait of Hormuz. That shift was enough to pull capital back into crypto, equities, and other higher-beta assets. Still, this remains a headline-driven market, so the rebound looks constructive—but not fully secure.
Market structure: broad-based rebound, not just Bitcoin
- Bitcoin surges 1.7% today to $74,500, after dipping near $70,600, showing a quite strong reversal.
- This upward move is not a crypto-only move; U.S. equities and risk assets also rebounded, reinforcing the macro nature of the rally.
- Ethereum led gains (+7.9% to $2,365), with XRP +3.2%, Solana +4.9%, GMCI 30 +4.9%, pointing to broad risk appetite.
- Crypto equities confirmed the move with shares of Circle +12%, Bullish +7.5%, Coinbase +3.9%.
Macro driver: geopolitics and oil easing pressure
- The key catalyst was a partial unwind of geopolitical risk, after signals of progress in U.S.-Iran talks.
- Markets reacted to the idea that a reopening of the Strait of Hormuz may still be achievable.
- This matters because Hormuz impacts oil, inflation expectations, and global risk sentiment.
- Oil fell easing macro pressure and supporting risk assets.
What matters next: flows, levels, and risks
- ETF inflows and whale accumulation remain critical in stabilizing the market and supporting the rebound.
- $70,000 is key support, defining whether the structure remains intact.
- $72,000–$75,000 is the key resistance zone—holding above it would strengthen the bullish case.
- Upside drivers: improving macro tone, falling oil, strong flows, and cross-asset momentum.
- Downside risks: no final geopolitical resolution and high sensitivity to new headlines.
- Investors should watch closely Bitcoin dominance, Fed signals, macro data, and energy markets for confirmation or reversal.
- Momentum has returned and the rebound is broad, but until the macro backdrop stabilizes, this remains a fragile, event-driven market rather than a clean trend continuation.
Bitcoin (D1 chart)
Looking at the Bitcoin chart, we can see a geometric 1:1 structure, which means that $75k - $76k level may be crucial for a rebound, while falling from this level may lead to another long positions liquidation and sell-off even below $60k.
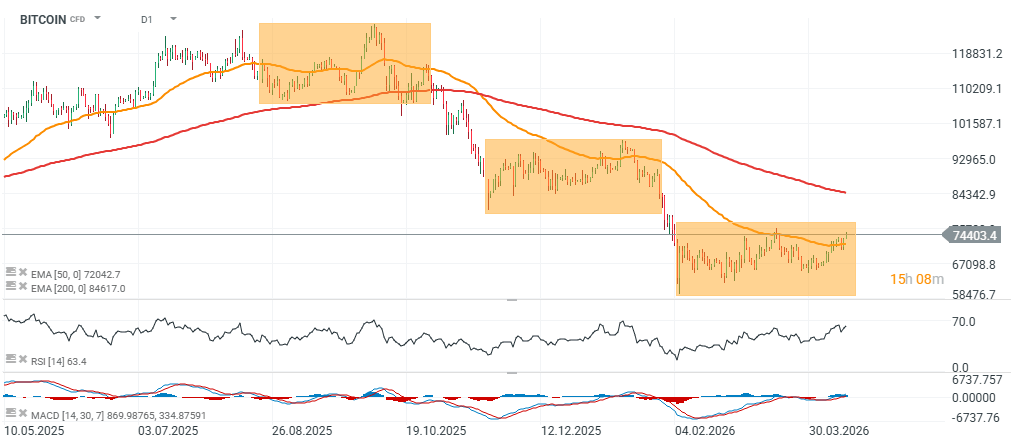
Source: xStation5
ETFs are buying Bitcoins again? Bloomberg data shows that the answer is - yes. We can see quite large improvement in investors' sentiments confirmed by Bitcoin ETFs activity.
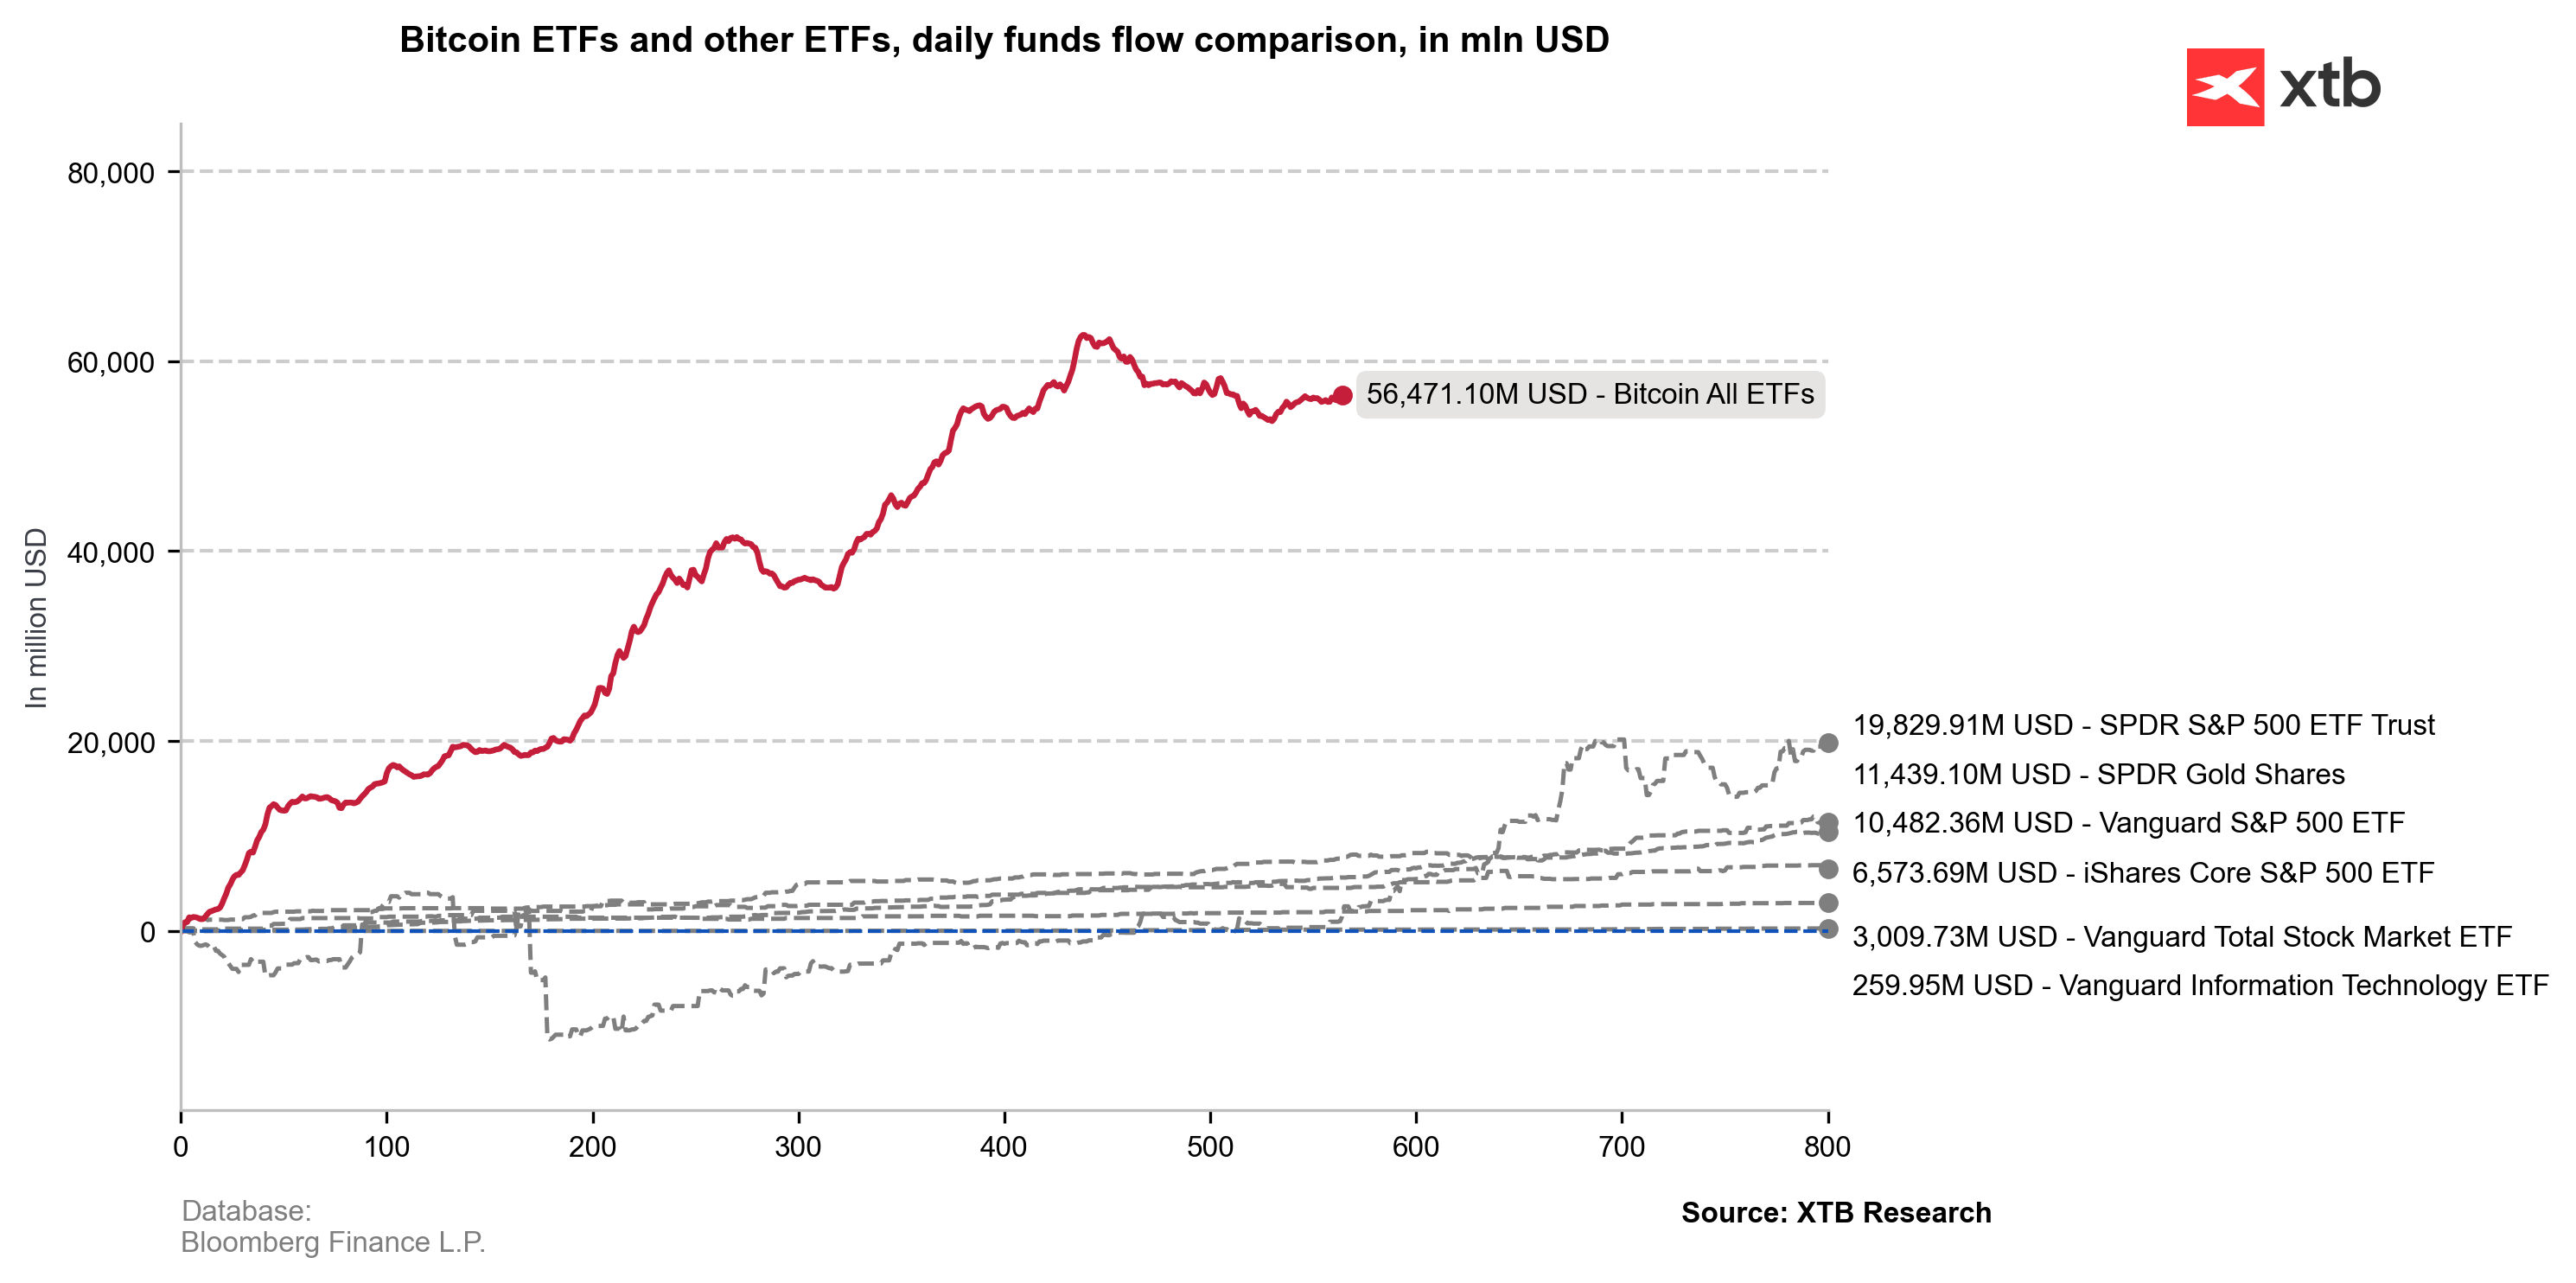
Source: XTB Reserach, Bloomberg Finance LP
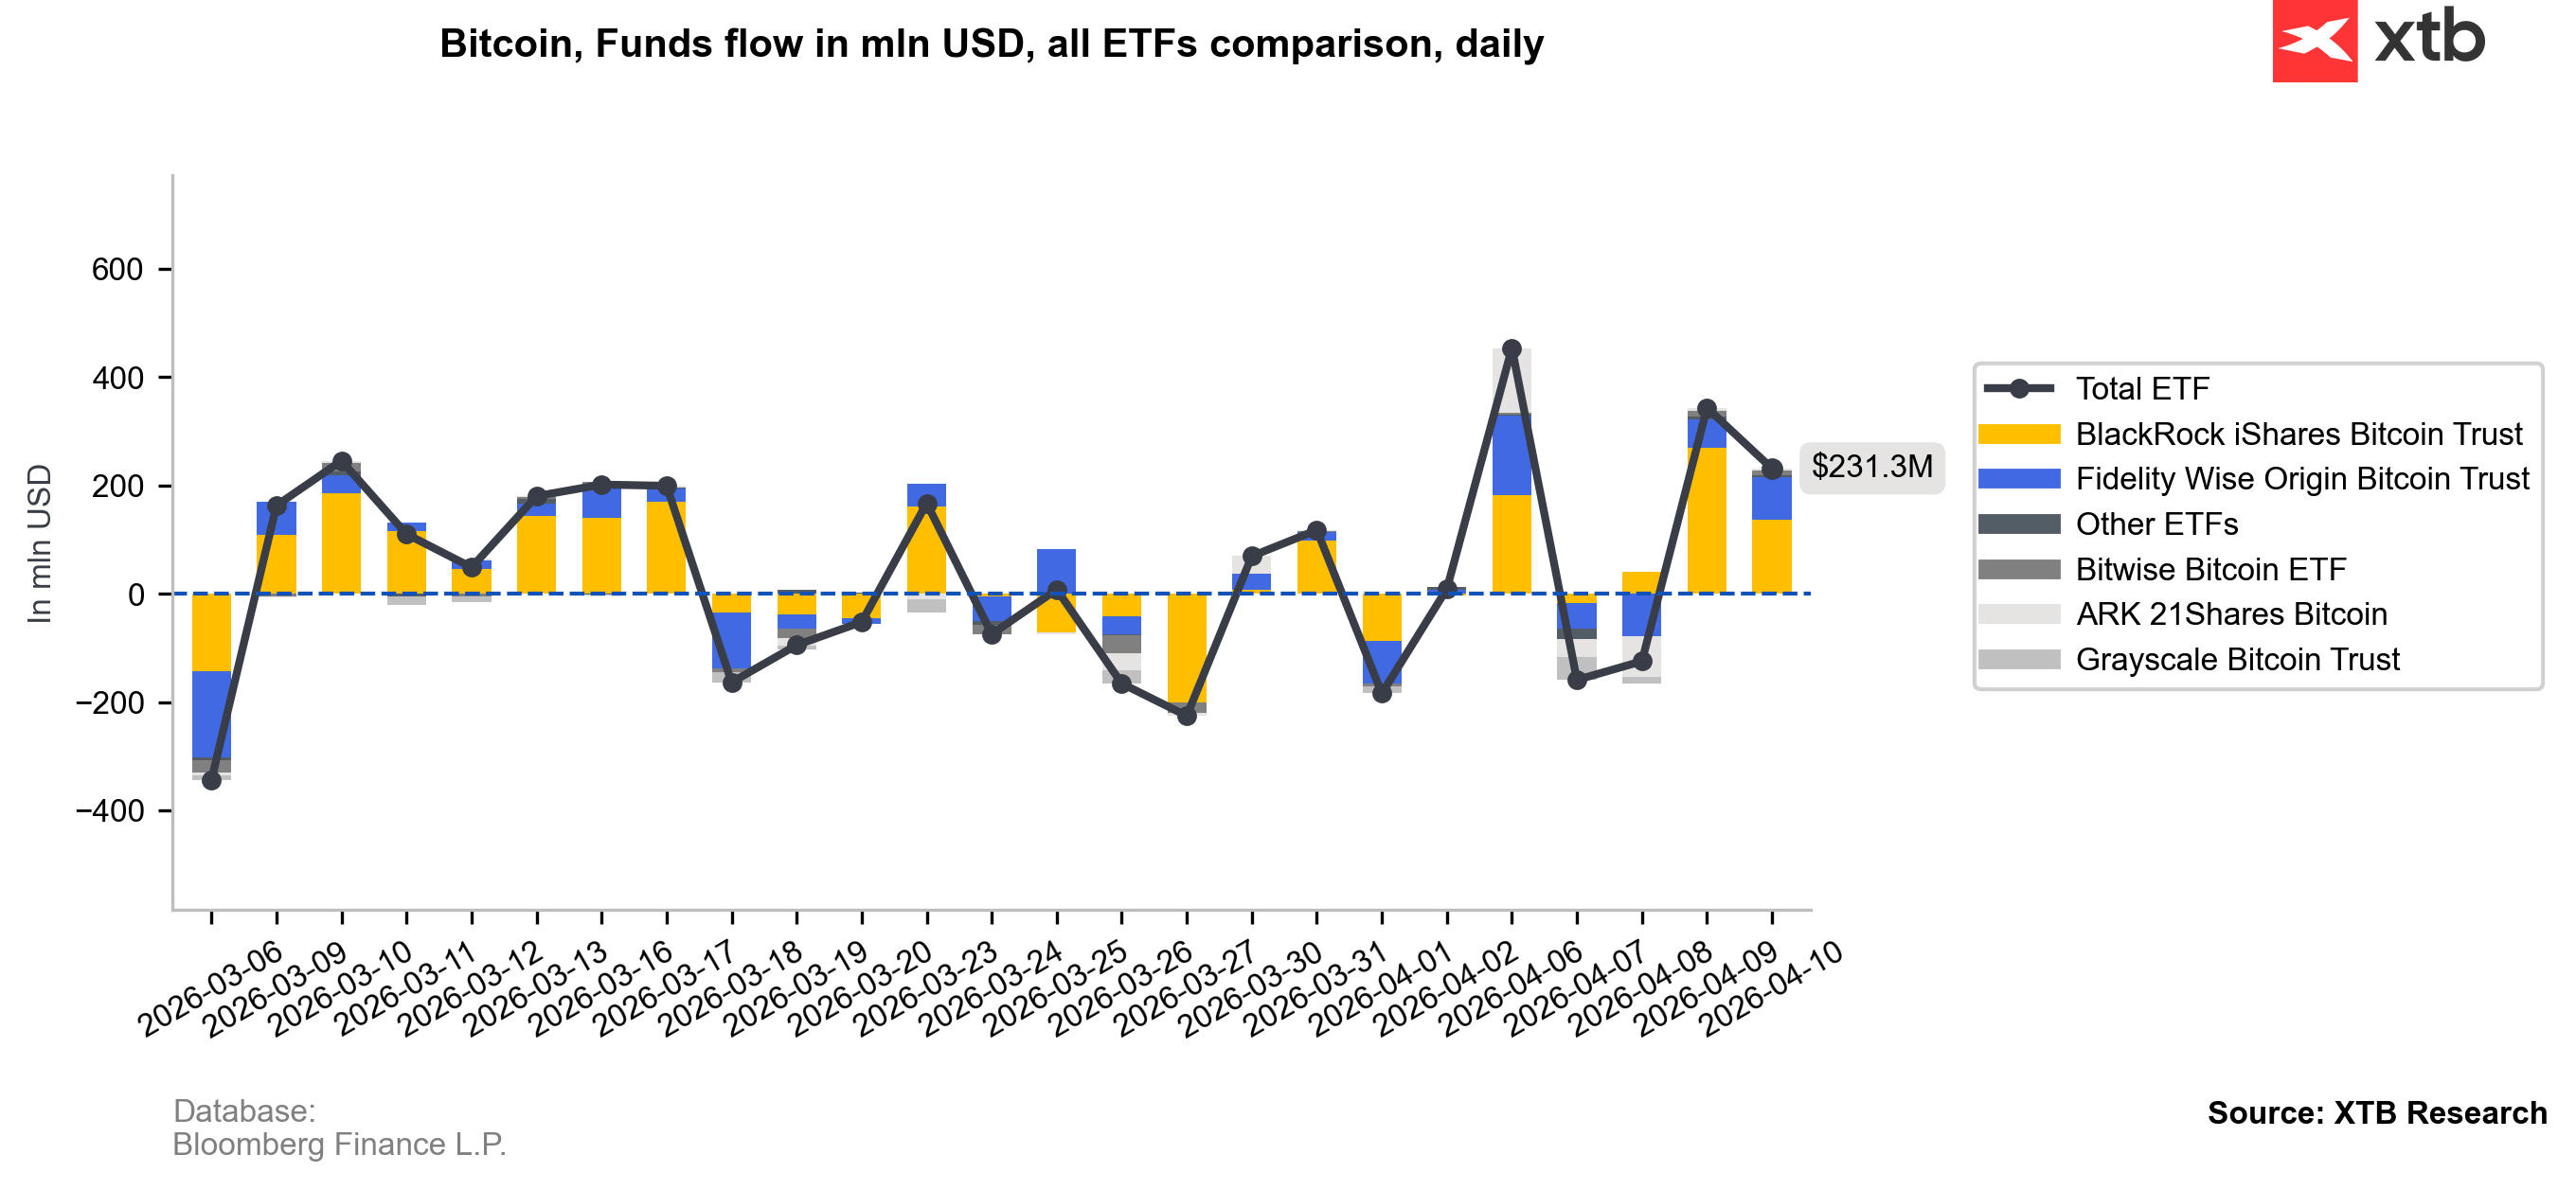
Source: XTB Reserach, Bloomberg Finance LP

Daily Summary: Semiconductors Rise in the Shadow of Geopolitical Turmoil

Tech sector catches its breath 🚀

Red Sea, but not the indices : The effects of the Bab al-Mandab blockade.

US OPEN: Semiconductors drive a rebound