



Brent crude lost over 3.5% on Monday, dropping to nearly 109 USD per barrel and erasing almost all of last week's gains. WTI crude fell by a similar margin to around 100 USD. At first glance, this movement is surprising, as President Trump assured over the weekend that he does not intend to give up the military option against Iran. However, the market reacted not to his words, but to Axios reports according to which he told Israeli Prime Minister Benjamin Netanyahu that he wanted to give diplomacy more time before considering resuming strikes. Secretary of State Marco Rubio confirmed on Saturday that no decision on new attacks has been made and that the President prefers a diplomatic solution.
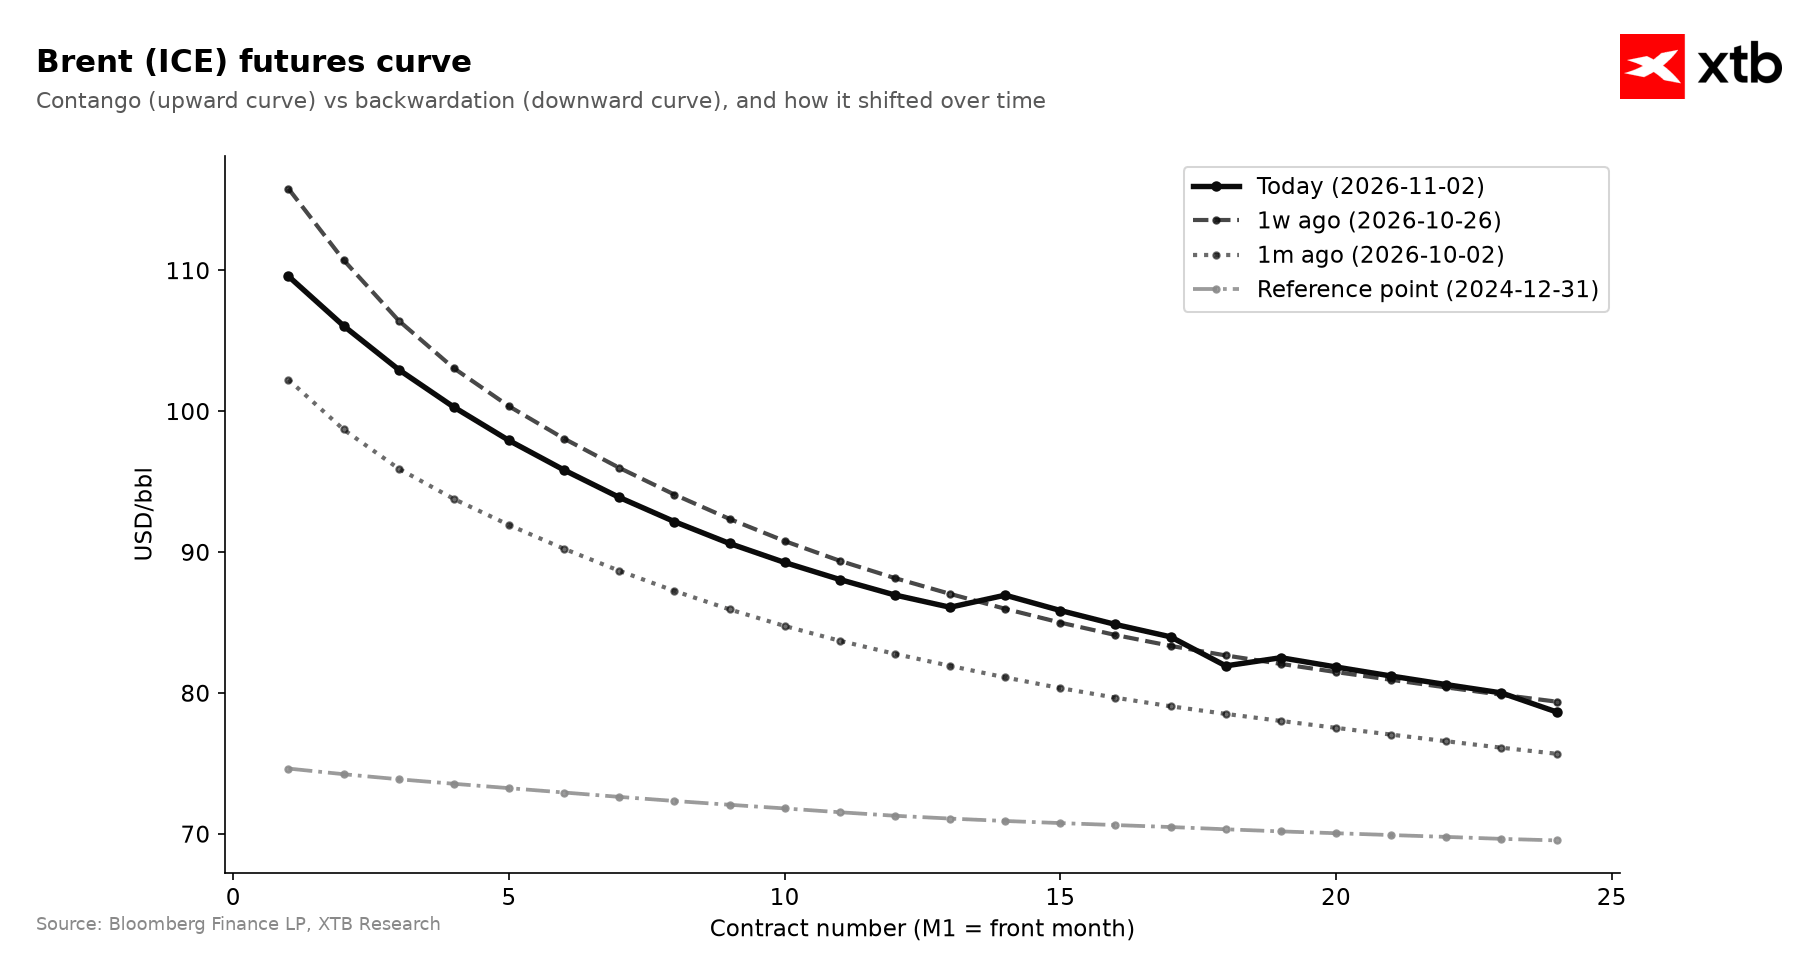 The forward curve for Brent crude is falling over a perspective of at least one year. Source: Bloomberg Finance LP, XTB
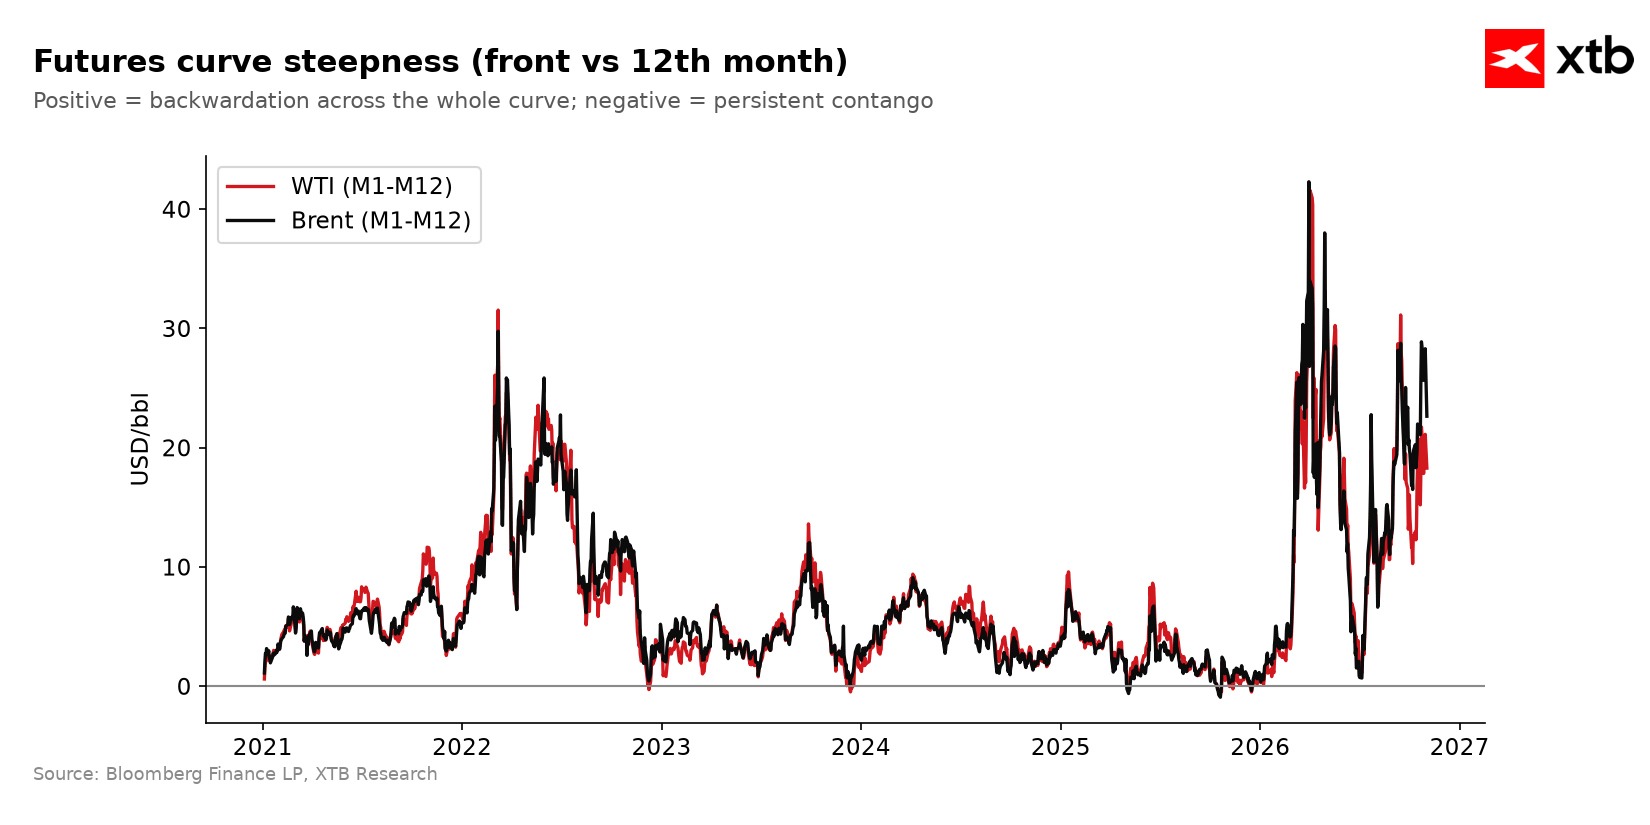 Steepening of the curve over a one-year period (M1-M12) indicated significant overbought conditions, as the spread reached nearly 30 USD. Source: Bloomberg Finance LP, XTB
This is a classic example of a situation where the market places more trust in unofficial leaks about real intentions than in official, tough rhetoric. As Arne Lohmann Rasmussen from A/S Global Risk Management points out: war is unpopular in the US, partly due to high fuel prices, and the president has a political interest in signaling the possibility of ending the conflict. In his view, diplomatic signals may be tactical in nature and calculated for the time just before Tuesday's midterm elections.
It is precisely the elections that are key to understanding today's movement. According to earlier Wall Street Journal reports, the US informed several Persian Gulf countries to prepare for a possible short, intense military campaign against Iran, but only after Tuesday's elections. The market interprets this as a signal that any hard actions are being postponed until after the polls close, which in the short term distances the risk of escalation and removes part of the geopolitical premium from the price of oil.
At the same time, the picture is not unambiguously dovish. Iranian Foreign Minister Abbas Araghchi admitted on Sunday that talks with Qatari mediators regarding the opening of the Strait of Hormuz are still ongoing, but have not resulted in an agreement, and no direct meeting with the American side is planned. On Monday, the Iranian Foreign Ministry informed in turn that it is considering shortening its plan to restore full security of navigation in the strait to two days, provided that the US meets Iranian demands. Spokesperson Esmaeil Baqaei emphasized that this is another proof of Iran's good will. Importantly, despite these declarations, two more incidents involving tankers occurred in the Hormuz region over the weekend, and Iran's Supreme Leader Mojtaba Khamenei reportedly instructed military commanders to prepare for a renewed confrontation with the US and Israel. The market is therefore trading today at the intersection of two conflicting signals: a tactical gesture towards diplomacy before the elections and an ongoing military risk that could return immediately afterward.
On the purely market side, pressure on prices was additionally exerted by the decision of seven OPEC+ producers, including Saudi Arabia and Russia, to maintain output limits unchanged for December. The group's next meeting is scheduled for November 29. Vortexa data also show that the amount of oil in floating storage fell in the week ending October 30 by 11% to its lowest level since July, suggesting an improvement in supply liquidity after months of disruptions around Hormuz. Meanwhile, Goldman Sachs raised its December Brent price forecast to 105 USD, citing elevated geopolitical risk, and warned that in the event of escalating tensions with China or in Hormuz, oil could test the 120 USD level again.
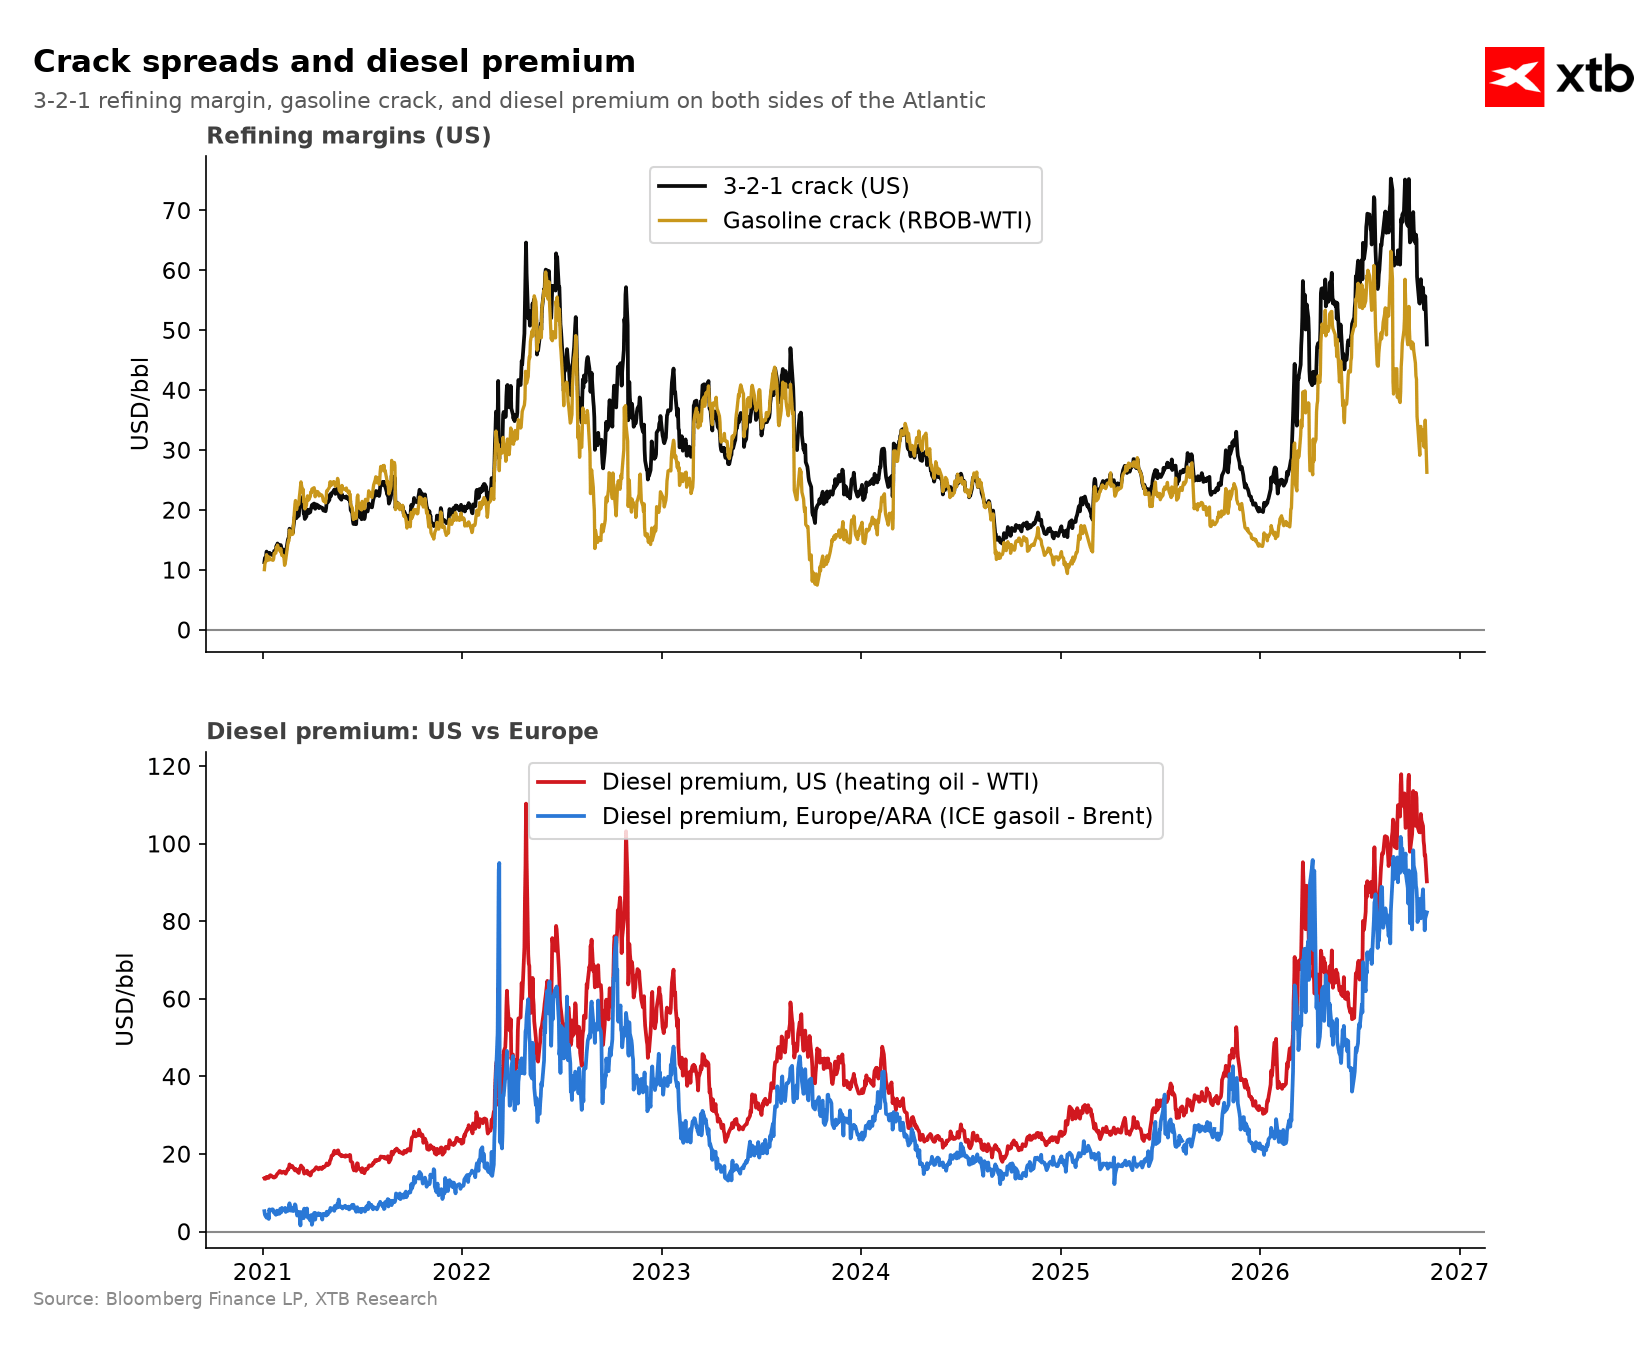 It is worth noting how sharply gasoline and diesel premiums have fallen, especially in the US. This is also reflected in fuel prices in the market. While oil is near March levels, fuel prices are falling. This could be related to two factors: real demand destruction in the West or an artificial reduction in prices right before the US elections. Additionally, barrels might also be liquidated in Europe. Source: Bloomberg Finance LP, XTB
Technical Analysis: Brent Crude (OIL)
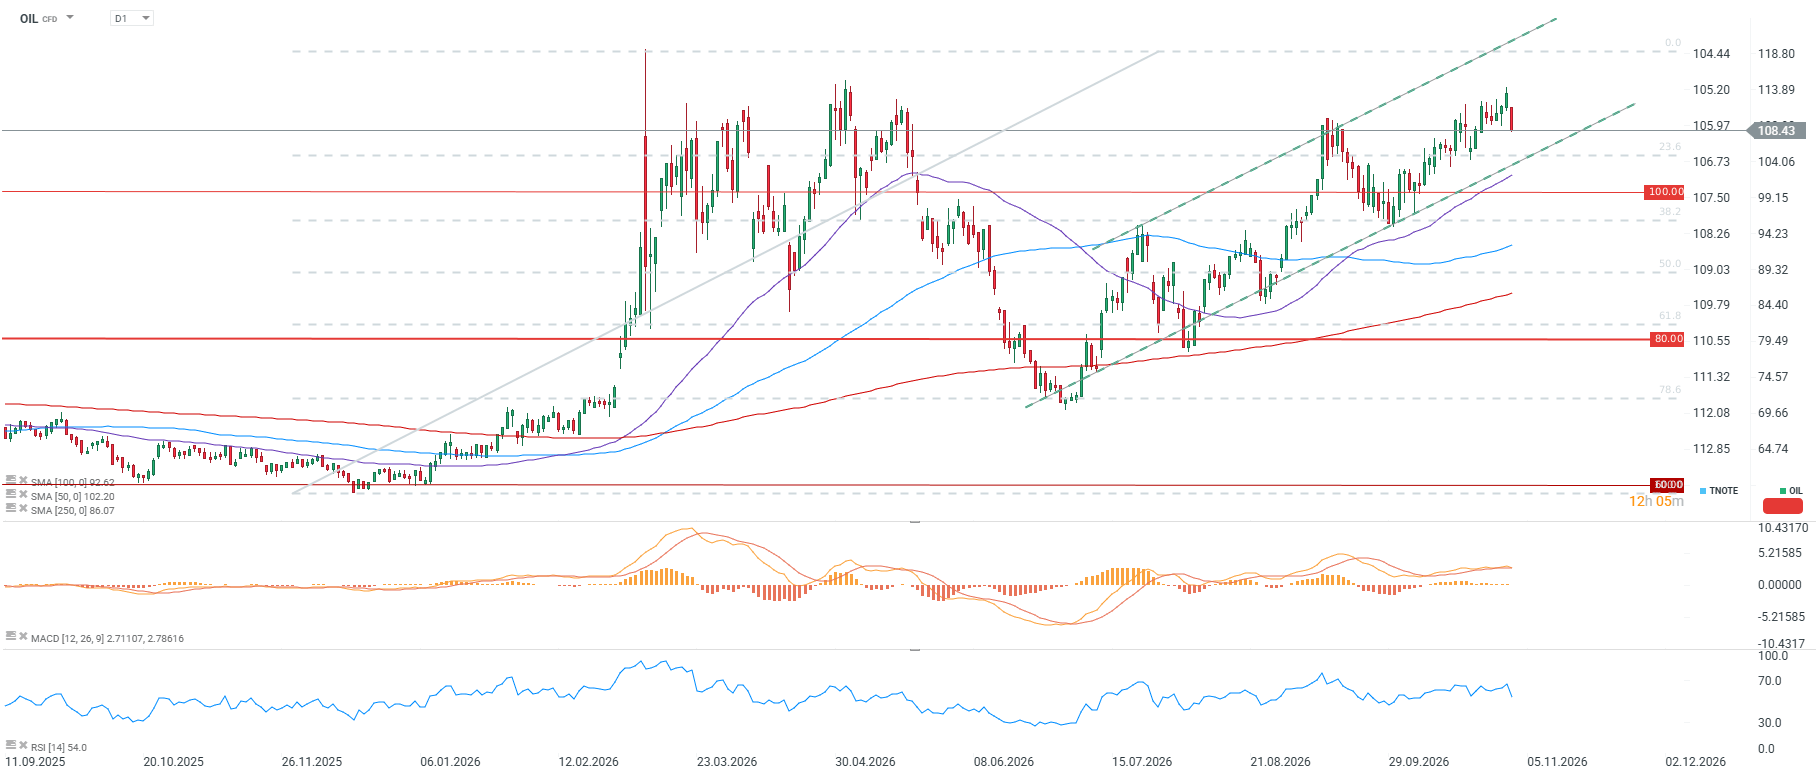
- After a dynamic rise in October, during which Brent reached six-month highs around 113–114 USD, quotes pulled back significantly. The current level below 109 USD marks a return to the region of previous resistance, which now serves as support.
- The price remains above all three key moving averages: SMA50 (approx. 102.2 USD), SMA100 (approx. 92.6 USD), and SMA250 (approx. 86.1 USD), meaning that the long-term uptrend lasting since September 2025 remains intact despite today's sell-off.
- The price is within an ascending trend channel. Key support remains its lower boundary, reinforced by a zone near the 23.6% retracement level of the recent upward wave.
- The RSI at 54 remains in neutral territory, with no signs of being overbought, while the MACD histogram (2.71 vs. signal line 2.78) clearly flattens and moves toward negative values, signaling a fading of the earlier strong upward momentum.
- On the resistance side, the key zone remains associated with the recent highs around 112–113 USD. Reclaiming and holding this area would open room for another attack on the peaks near 116–117 USD, and in an escalatory scenario, even toward the levels indicated by Goldman Sachs (120 USD).
Scenarios:
- Bullish scenario: The breakdown of talks in Doha, new incidents in the Strait of Hormuz, or confirmation that the US and Israel are resuming preparations for strikes on Iran right after Tuesday's elections could quickly restore the geopolitical premium. Technical confirmation of buyers returning would be reclaiming the 113 USD level, opening the path to 117–120 USD.
- Bearish scenario: Real progress in negotiations, Iran shortening its plan to reopen Hormuz to the declared two days, and maintaining the OPEC+ decision on stable production limits would favor the continuation of today's sell-off. Breaking support at 100 USD would open the way to the 96–98 USD zone, and subsequently toward 88–90 USD.


Economic Calendar - Global series of industrial PMI indicators and tech giants' results



📊Morning Wrap: Oil falls after Qatar talks. China injects liquidity, while the US prepares for elections.


💥Daily Summary: Tech Sector Crash on Wall Street and Historic Attack on Binance


🔴Three Markets to Watch Next Week: US500, BITCOIN, EURUSD (30.10.2026)