
Cryptocurrencies are on the move in recent days. Softer inflation readings from the United States triggered a slump in USD and supported riskier assets, including cryptocurrencies. Moreover, it was reported recently that the London Stock Exchange will offer regulated trading and clearing in Bitcoin derivatives, namely futures and options. Improvement in moods towards cryptocurrencies led to some of the major coins breaking through key psychological levels - Bitcoin climbing above $30,000 mark, Ethereum smashing through $2,000 handle and Ripple moving back above $0.50 mark.
Taking a look at ETHEREUM chart at D1 interval, we can see that the coin has been trading in an upward channel since November 2022 and a break above it occurred recently. Coin climbed above the $2,000 mark yesterday for the first time since August 2022. Coin has also broken above the $2,013 area, marked with the August 2022 peak and is trading at the highest level in almost a year (since mid-May). The $2,290 area marked with the upper limit of the Overbalance structure will be the next test for Ethereum bulls and a break above it would hint at a bullish trend reversal, at least according to the Overbalance methodology.
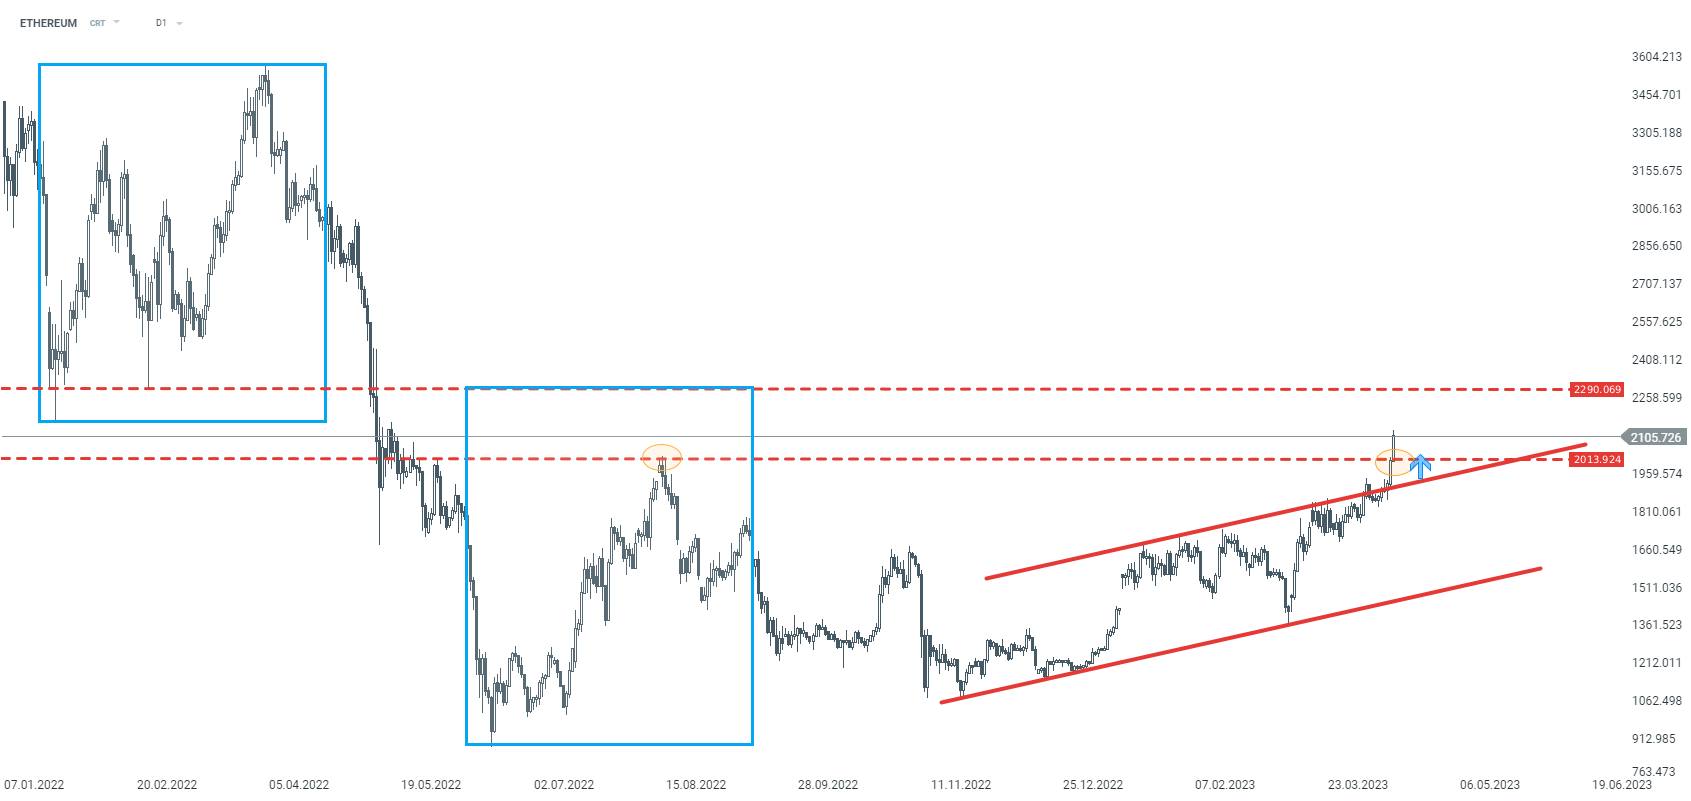 Source: xStation5

Daily Summary: Trump's War Threats Weigh on Markets. Wall Street Sinks into the Red

Bitcoin Climbs Above $66,000 as ETF Flows Recover but Glassnode Warns of Higher Volatility

Morning Wrap: Oil Climbs Back Above $90 as Chinese AI Weighs on Tech Stocks.

Morninga Wrap: Wall Street Under Pressure. AI Loses Momentum, Netflix Disappoints, and the Persian Gulf Erupts