
Since yesterday's PMI data in Europe came out mixed (Germany slightly better than expected, France decidedly weaker), today's flash S&P PMI readings from the US (2:45 PM GMT) may end with rising volatility on EURUSD. Of course, in comparative terms, European macro climate compared with US still performs incomparably poorly, which in the medium term may affect the perception of the situation and room for growth on the Eurodollar. Today's Ifo readings from Germany also performed weak and came in lower than expected. Also Germany's y/y GDP revised downward from -0.3% to -0.4% in Q3. However, this did not affect the EURUSD's weakness; the main pair's reaction was quite limited, signalling that the market is waiting for US data.
Investors invariably expect the Fed to begin easing policy in 2024, and the Fed's minutes from its last meeting reinforced the markets' belief. Analysts expect the U.S. manufacturing PMI to fall to 49.9, just below the 50 level that separates expansion from slowdown. A potentially positive surprise in this reading could strengthen the dollar and indicate that U.S. industry is not even on the 'brink of recession' yet. On the other hand, however, PMI data in line with or weaker than forecasts could mean that the U.S. economy is beginning to cool, limiting the potential for any hawkish central bank interventions. For bulls, this could provide fuel for continued EURUSD gains.
US PMI vs. Europe's PMI
US (S&P PMI flash readings, November).
- Services. Expected: 50.3 Previous: 50,6
- Manufacturing: expected 49.9 vs. 50 previous.
- Composite: Expected 50.4 vs. 50.7 previously
France (PMI, November):
- Industry. 42.6 expected: 43.0 previous: 42,8
- Services. 45.3 Expected: 45.6 Previous: 45.2
Germany (PMI November)
- Industry. 42.3. Expected: 41.2. Previous: 40.8
- Services. 48.7 Expected: 48.5 Previous: 48.2
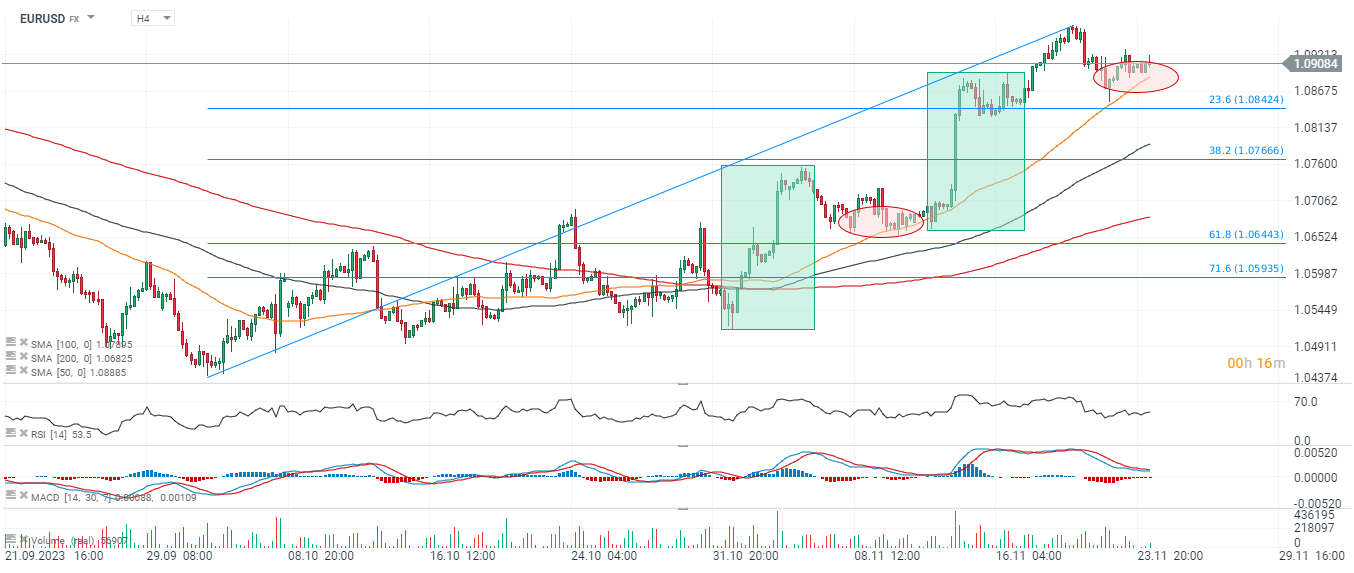
EURUSD (H4 interval)
Looking at the chart of the EURUSD, on the 4-hour interval, we can see that since the pair started a stronger upward movement, we have seen two upward geometrical setups, and the SMA50 moving average (orange line) has provided important support for the dynamic upward trend. Looking at the layout of the market's geometry, the extent of a potential next breakout could take EURUSD even above 1.1100, and as long as the price holds the SMA50 as support, this scenario is on a table. On the other hand, a potential drop below the SMA50, on high volume, could negate the 'bullish' scenario and herald a correction of the previous move to the area of 1.084, where we see the 23.6 Fibonacci retracement of the last upward wave.
 Source: xStation5

Economic Calendar: Time for Tesla and Google Earnings (22.07.2026)

Morning Wrap: AI companies and gold back in favour? (22.07.2026)

Daily Summary: Semiconductors Rise in the Shadow of Geopolitical Turmoil

Market Wrap: Airlines Under Pressure, Europe Resists Expensive Oil