
Looking at the EURUSD chart on the D1 interval, one can see that the pair has been in an uptrend since the beginning of April. Nevertheless, in recent days the pair has fallen into a consolidation between support at 1.2175 and resistance at 1.2240. Therefore, one should wait for the breakout to one of these levels to determine the further price direction. Should a break higher occur, then an upward impulse towards this year high at 1.2330 could be launched. On the other hand, if the support is negated, the downward correction may deepen. In such a scenario, the red trend line should act as nearest support.
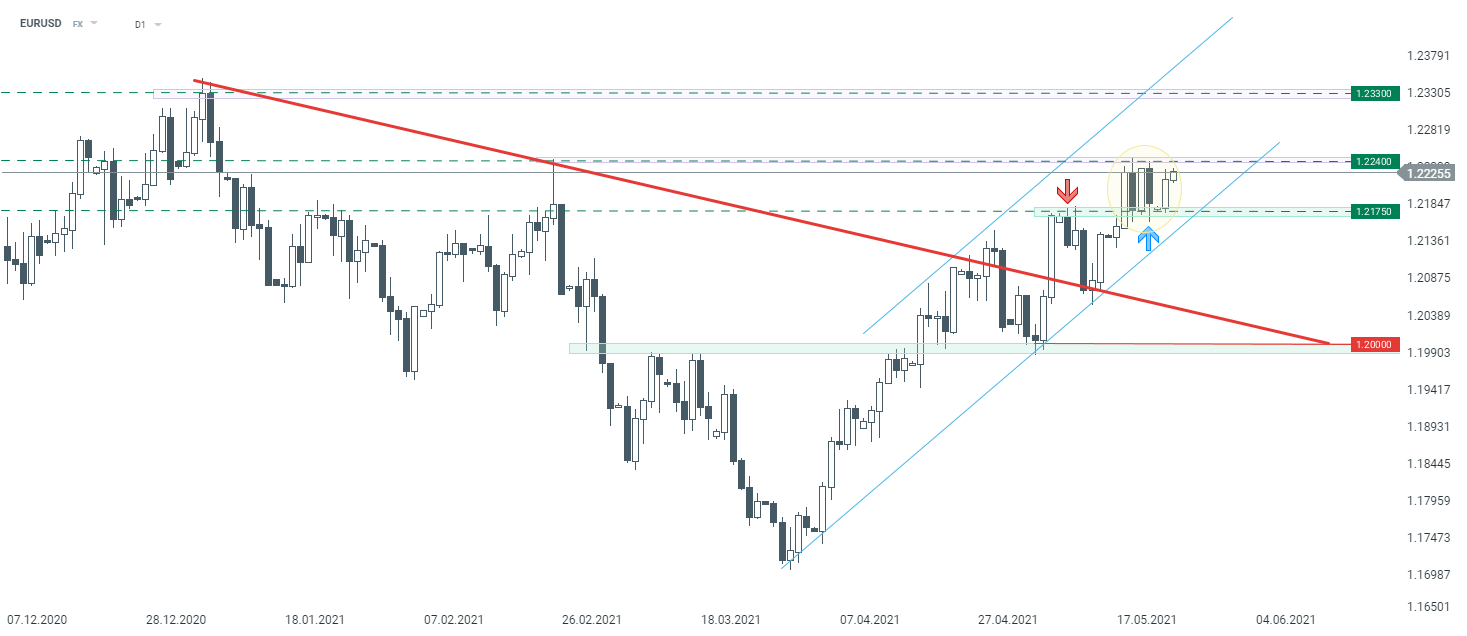 EURUSD interval D1. Source: xStation5

Daily Summary: Wall Street Regains Ground; Another Intervention in the Yen Market❓

Three Markets to Watch Next Week (July 31, 2026)

Market Wrap: European equities at 3-week highs! Apple dips in US premarket!

Chart of the Day: EURUSD after the Fed meeting. The market scales back rate hike expectations