



Investors' attention during today's session will be focused on the US CPI data reading for November, which will be the last key indication before the Fed's scheduled meeting on Wednesday. Economists estimate that in y/y terms, the headline reading will indicate a slight slowdown in the growth rate of prices and services in the US economy, while the core reading for the same snapshot will show the dynamics remaining at the same level.
- CPI inflation (y/y). Expected: 3.1% y/y. Previously: 3.2% y/y.
- Core inflation (y/y). Expected: 4% y/y. Previously: 4% y/y.
- CPI inflation (m/m). Expected: 0% m/m. Previously: 0% m/m.
- Core CPI inflation (m/m). Expected: 0.3% m/m. Previously: 0.2% m/m.
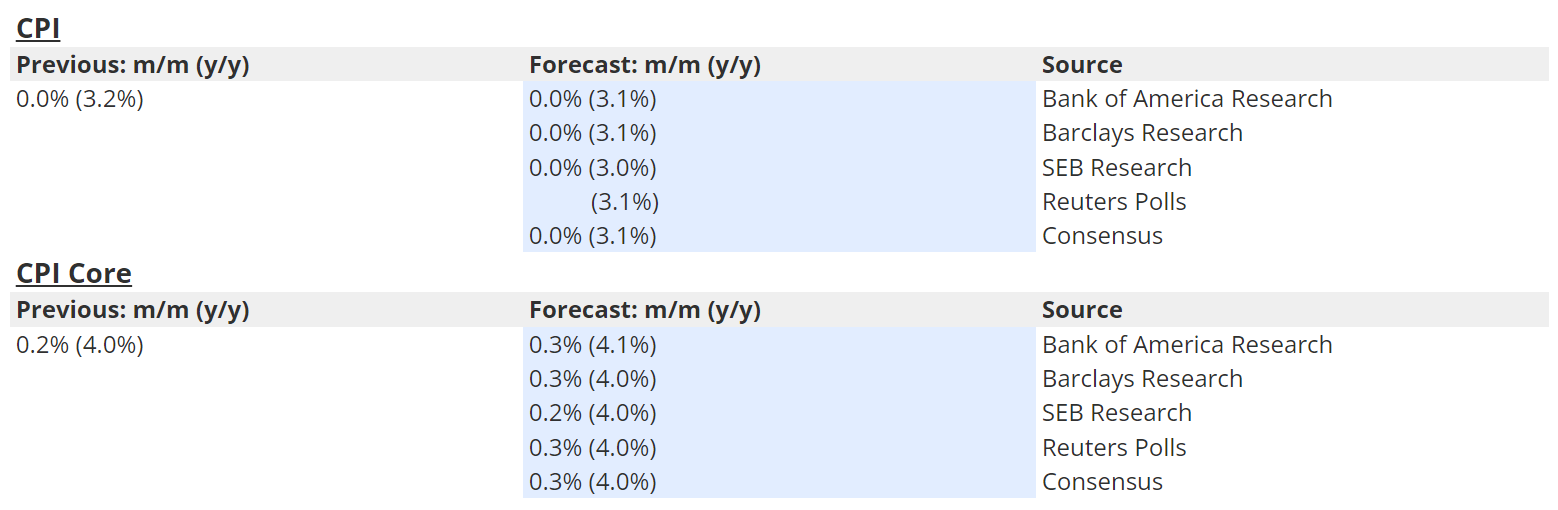
Analysts themselves are almost unanimous in their assessments, with the distribution of votes tilting nicely toward a lower reading. Source: eFX
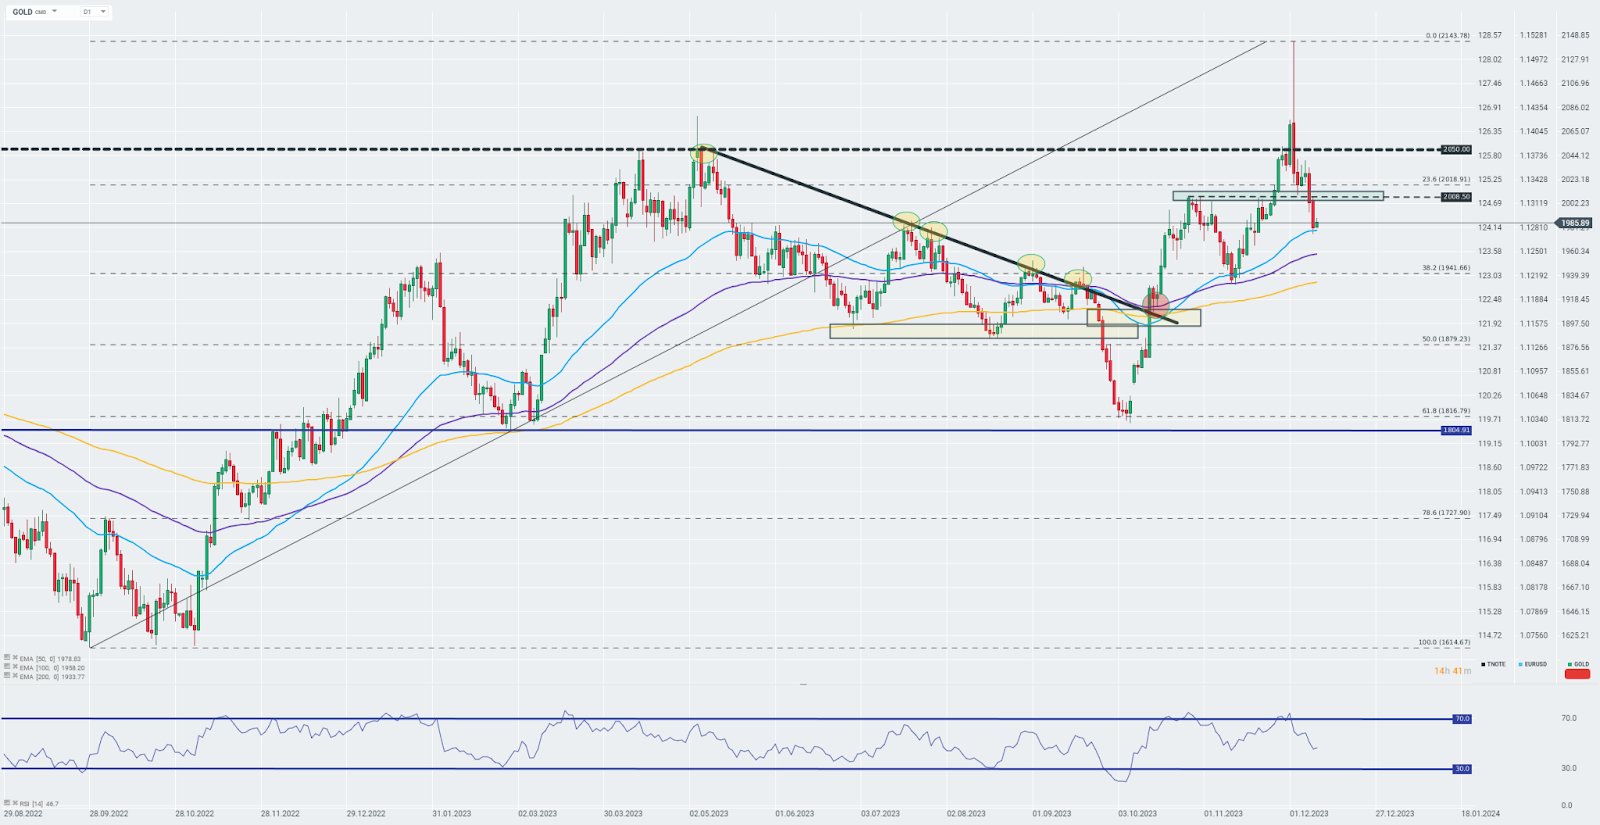
For that matter, the instrument that may record increased volatility when the report is released is gold (GOLD). The precious metal is currently holding in the support zone defined by the 50-day exponential moving average (blue curve on the chart), which may currently be the main control level for GOLD. A possible upward breakout could take gold to the zone of the psychological barrier of $2,000 per ounce (another historically important supply zone). The nearest support after a possible bottom breakout from the 50-day EMA could be the blue curve, which is the 100-day EMA.
Source: xStation



Three Markets to Watch Next Week (09.10.2026)



Daily Summary: A Shallow Rebound Ahead of Earnings Season


Strong rise in natural gas prices 📈🚨



US OPEN: Trump de-escalates, OpenAI supports Wall Street sentiment